Initially I got really excited when I heard about Trulia launching crime maps yesterday. If during your home search you’ve ever tried researching the crime in your prospective neighborhood you’ve probably encountered a great deal of frustration. The reason is that the data has never been easy to look at or interpret. It’s often so granular to be useless – e.g. specific crimes at specific addresses on specific dates. Even the summary data is often only aggregated at the level of 2 weeks – hardly a meaningful time period.
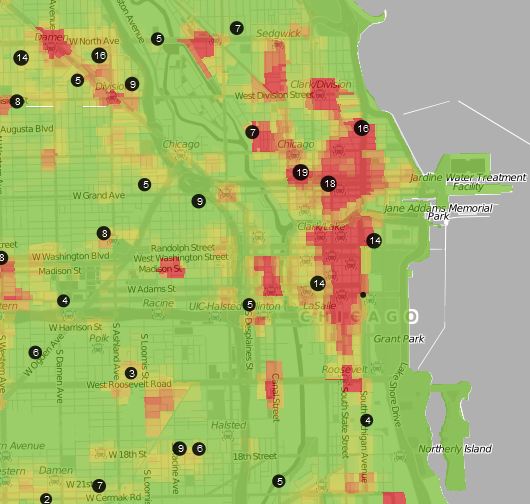
So when the news hit about Trulia’s new feature I immediately pulled up the Chicago crime map shown below.
After you study it for a few minutes it drives home the challenge of trying to figure out if a neighborhood is “safe” using all the available data. What’s wrong with this picture? It displays the number of incidents per block per year. Therefore, all else being equal, densely populated areas get penalized because they have more people per block and are therefore more likely to have crime. More people = more victims = more criminals = more crime. In the map above some of the most desirable parts of the city are glowing red – River North and the Loop for instance.
Not to mention that these crime maps are in beta so they don’t quite work as you’d expect. For instance, changing what crimes you want to look at does not seem to change the map. But that would be easy for Trulia to fix.
What you really want to look at is the number of crimes per resident per year. I’ve done this analysis of Chicago crime as a percentage of population before and it makes a lot more sense. However, a) my data is a bit old (been meaning to update it) and b) I can only do it at the official Chicago community area level and c) there are even flaws in that methodology. Regarding this latter point, check out property crime for the Loop. It’s off the chart. And the reason is probably because every day people pour into the Loop (they don’t live there) creating lots of crime opportunities. So the “effective population” of the Loop is much higher than the numbers suggest – i.e. my denominator is understated and hence the percentage is overstated.
I wish I had a better answer for people trying to determine if a neighborhood is safe but sometimes the only thing you can do is drive around at different times of day and see if you like the feel of the neighborhood. One warning sign would be a lot of young adult males loitering on the street in the middle of the work day. Under employed males = more crime.

@gary, thanks for the feedback. You are right, there are variables that we have not included in this initial beta launch. I wish we had perfect information, but are limited by our data sources. We looked into creating a per capital map, but getting population density on a per street, intersection or block basis is not easy. We’re hoping to include a historical time slider, more cities, and a violent vs. nonviolent map in the next iteration. If you have any additional feedback or want to chat, feel free to reach out at eric@trulia.com.
-Eric Wu
Head of Geo Products
I would just do it at the census tract level. Population numbers are certainly available at that level and it’s a small enough area to be meaningful and yet big enough to be more representative of what is going on.
I think you are right, we’ll work on the next iteration and I’ll give you a sneak peak before we release. Thanks again for the feedback.
It also looks like maybe traffic crimes weren’t included in the data? In many communities, more people are injured and killed by reckless drivers than by other criminals. Drivers killing people in crosswalks with their cars post just as much a threat to our safety as gangs and robbers.
Can you point to statistics for Chicago that support that claim? It’s hard to believe.
I wasn’t talking about Chicago specifically, since Trulia covers more than just our city. Car crashes are the leading cause of death for Americans ages 5-35: http://www.cdc.gov/motorvehiclesafety/ . Almost all crashes are avoidable and are caused by drivers failing to exercise the care that’s appropriate when operating a deadly machine. People kill other people on our streets every day and for some reason nobody thinks anything of it.
In Chicago, there is this report from 2001-2005 specifically about pedestrian crashes in our city: http://www.walkinginfo.org/library/details.cfm?id=4459
“Over the years 2001 to 2005, an average of more than 3,700 pedestrian-motor vehicle collisions has been reported each year from Chicago to the Illinois Division of Motor Vehicles. On average, 71 pedestrians were killed and around 930 were reported seriously injured during each of these five years.”
And then there’s of course additional crashes just between cars and between cars and bikes in Chicago. I can certainly tell you that in my neighborhood, where there’s not so much need to worry about gangs and robbers, I’m much more worried about getting hit by a car than getting mugged.