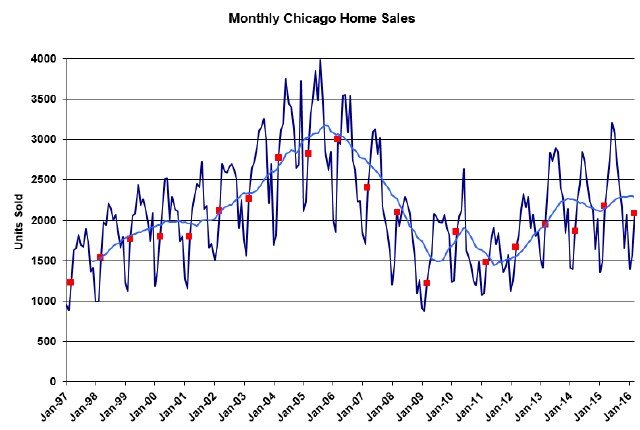
It looks like the Chicago real estate market is just continuing to struggle against the sales volume of last year. March was another sluggish month just like February was after taking out the leap day, down about 0.9% from last year.
My 0.9% decline will translate into a 3.4% decline according to the Illinois Association of Realtors in about 2 weeks when they compare the preliminary 2016 numbers to the final 2015 numbers.
My graph below puts the March numbers in historical perspective, with every March value flagged in red and a blue moving average line. As you can see, even though this March is down slightly from last year it’s still higher than 6 of the previous 7 years. On the other hand we don’t seem to have made a heck of a lot of progress in the last 3 years.
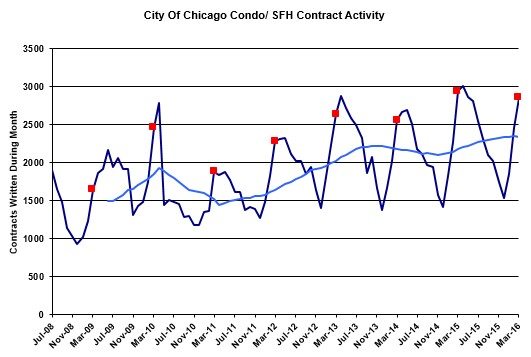
Chicago Home Contract Activity
Contract activity just doesn’t look that great either over the last 3 years. Similar to the graph above the blue trend line appears rather stagnant. I’m estimating that this March will be down 3.3% from last year, which could end up being the weakest contract comparison since November 2014. It’s this data that has been signaling for some time that our sales figures are not going to be that strong over the next couple of months.
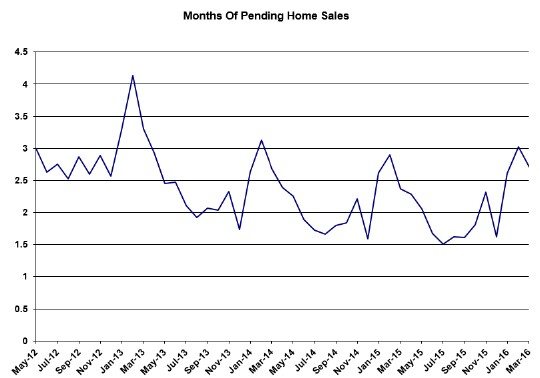
Pending Home Sales
The one positive note in last month’s data is the pending home sales figures. We ended the month with a 2.7 month supply of homes under contract vs. a bit less than a 2.4 month supply last year. That’s good because that helps drive closings over the next couple of months. Now, the really perceptive reader will ask how pending home sales could have gone up so much with contract activity weak. I dunno without doing a whole bunch more analysis but it’s a safe bet that it’s just a case of fewer contracts falling apart in the last month.
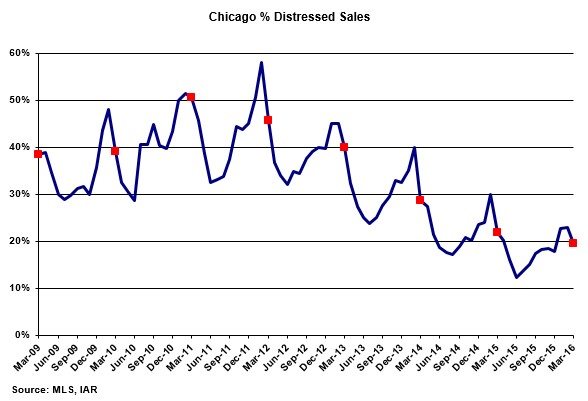
Distressed Home Sales
Clearly the distressed sales percentage is still declining but at an ever slower rate as you can clearly see in the graph below. March came in with only 19.6% vs. 21.9% last year and this factor explains a bit of the decline in overall sales — i.e. there are fewer distressed properties for sale and the sales of non-distressed homes is actually up year over year.
As I’ve shown before these distressed sales are increasingly concentrated in the poorer neighborhoods.
Chicago Home Inventory
Well, I would be worried about the low sales figures if not for the fact that home inventory remains incredibly low so there’s not enough for buyers to choose from. Condos (attached) are at a mere 2.9 month supply, down from a 4.0 month supply last year and detached homes are at a 3.7 month supply, which is down from 4.9 months last year.
As I pointed out last month Lake View is running counter to the trend in the rest of the city. There the supply of detached homes for sale is diverging from the supply of condos and townhomes, which are in much shorter supply. While there is a 7.2 month supply of detached homes in Lake View there is only a 2.6 month supply of condos and townhomes there and that 7.2 month supply is up from 3.7 months last year. And that 7.2 month supply is the highest level in 5 years.
Chicago Home Sale Market Times
With inventory being so tight we are finally starting to see some additional declines in market times. Condos that sold in March sold in 92 days, which is down from 102 days last year and detached homes sold in 100 days, down from 110 days last year. Those aren’t huge declines but they are the best numbers we’ve seen in 9 years.
#RealEstate #ChicagoRealEstate
Gary Lucido is the President of Lucid Realty, the Chicago area’s full service discount real estate brokerage. If you want to keep up to date on the Chicago real estate market, get an insider’s view of the seamy underbelly of the real estate industry, or you just think he’s the next Kurt Vonnegut you can Subscribe to Getting Real by Email using the form below. Please be sure to verify your email address when you receive the verification notice.


