After a weak March and several other months of languishing sales activity the Chicago real estate market came roaring back in April with the highest home sales in 9 years and the largest year over year gain in 9 months. Check out the graph below to see these numbers in their historic context. All the April data points are flagged in red and the blue line is a 12 month moving average. However, that blue line is still not quite flashing an upward trend again.
April Chicago home sales were up a whopping 10.1% over last year but when the Illinois Association of Realtors announces the official numbers in a little less than 2 weeks they are going to report it as a 7.9% increase.
Another fun fact about these numbers is that when they get finalized (it takes several weeks for all the sales to be reported) I believe that only 5 of the last 20 Aprils will have had higher home sales.

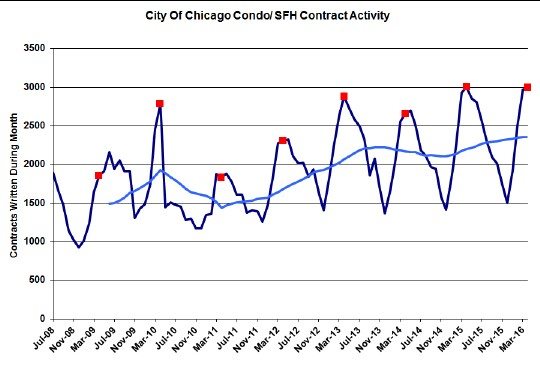
Chicago Home Contract Activity
Chicago home contract activity continues to be unimpressive, with the April contracts not being all that much higher than the previous 3 years. You can see it in both the red flagged points in the graph below and in the blue moving average line. At this time I’m estimating April contract activity to be actually down about 0.5% from last year, which does not bode well for May and June sales. And this would be the weakest year over year comparison in the last 17 months.
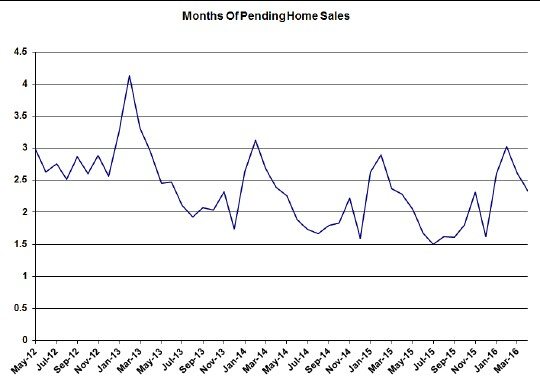
Pending Home Sales
The net result of new contracts being written and sales closing is seen in pending home sales and that metric is basically signalling no real change from last year. At the end of April there were enough home sales pending to feed about 2.3 months worth of closings.
Distressed Home Sales
As has been the case for the last 5 years, distressed homes sales continue to comprise an ever shrinking share of home sales. April came in at a mere 14.0% vs. 20.3% last year. This decline in distressed home sales continues to be one factor dragging down overall sales but it’s the kind of sales we can do without – unless we’re trying to clear a backlog of foreclosures, which we sort of are still.

Chicago Home Inventory
The Chicago home inventory data should be no surprise to anyone who is looking to buy a home right now. Inventory is really tight and keeps getting tighter. Attached homes (condos and townhomes) are down to a 2.9 month supply from a 4.1 month supply last year. Meanwhile, detached homes are down to a 3.8 month supply from a 5.1 month supply last year.
However, the inventory of detached homes is going counter to this trend in at least two north side neighborhoods. Check out the inventory graphs for Lake View and Uptown. In both cases the inventory of attached homes is low but the inventory of detached homes is taking off.

Chicago Home Sale Market Times
The amount of time it takes to sell homes that do sell is declining slightly but, given how low inventory is, I’m surprised it’s not declining a lot more. For instance, the market time for attached homes was 78 days, down from 84 days last year and the market time for detached homes was 101 days, down almost negligibly from 103 days last year.
Once again, these are the best market times we’ve seen in 9 years.
#RealEstate #ChicagoRealEstate
Gary Lucido is the President of Lucid Realty, the Chicago area’s full service discount real estate brokerage. If you want to keep up to date on the Chicago real estate market, get an insider’s view of the seamy underbelly of the real estate industry, or you just think he’s the next Kurt Vonnegut you can Subscribe to Getting Real by Email using the form below. Please be sure to verify your email address when you receive the verification notice.