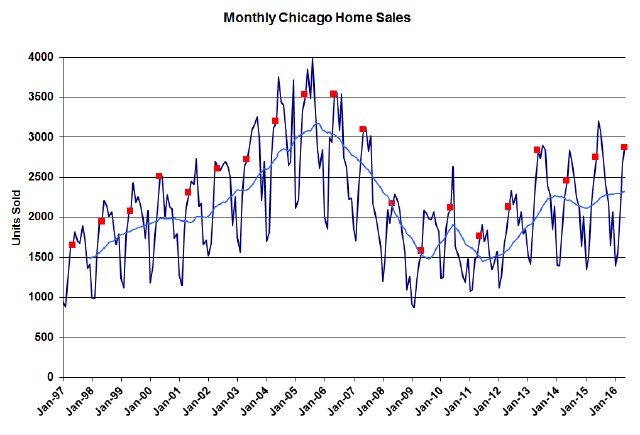
For the second month in a row the Chicago real estate market hit a 9 year high in home sales during May as you can see in the graph below, which goes back to 1997. On that graph all the May data points are flagged in red and I’ve also included a blue 12 month moving average line to give you a sense of the overall trend.
If you look closely at the graph you’ll see that the blue trend line has been trending upwards recently and you’ll also notice that May sales have only been higher 4 times in the last 20 years. Yeah, those were the bubble years.
May closings were up 6.9% over last year but the Illinois Association of Realtors will report only a 5.0% increase in about 2 weeks for reasons I explained long ago.

Chicago Home Contract Activity
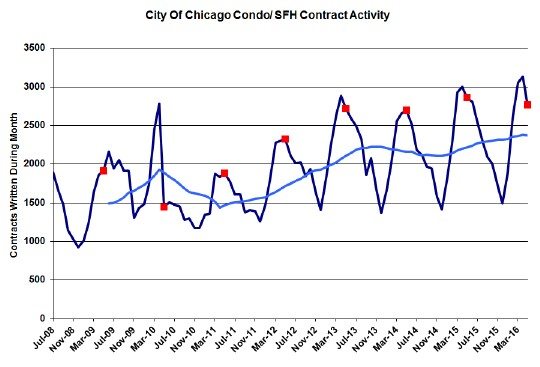
The only potential dark cloud on the horizon is that contract activity, which is a precursor to closings, is not really flashing signs of great strength right now. I’m estimating that May activity might actually have been down 3.5% from last year and that’s after several months of 4%ish gains. February was the exception though with a huge 14.5% gain.
If my estimate for May is correct it will have been the worst year over year performance in 18 months. However, estimating contract activity is tough because roughly 20% of contracts that are written eventually fall apart and it takes at least 3 months for most of this phenomenon to take place.
Nevertheless, if you look at the graph below the overall trend is definitely up over the last 6 years.

Pending Home Sales
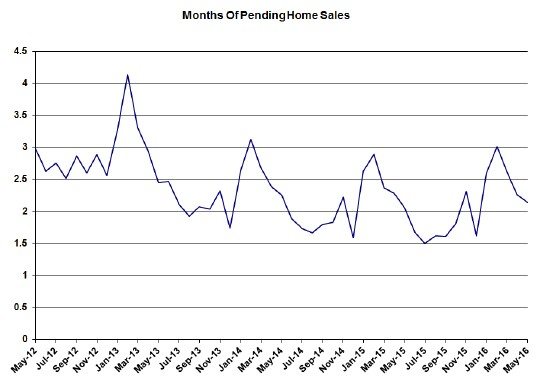
Pending home sales give us another window into the future of closings so I’ve graphed them below. In general, higher pending home sales should feed more closings in the next month or two. But don’t be fooled by the graph below. Where we are in the seasonal cycle creates the impression that we are on an upward trend but we are not. We ended May with a 2.1 months supply of pending home sales, which is barely up from last year.
Distressed Home Sales
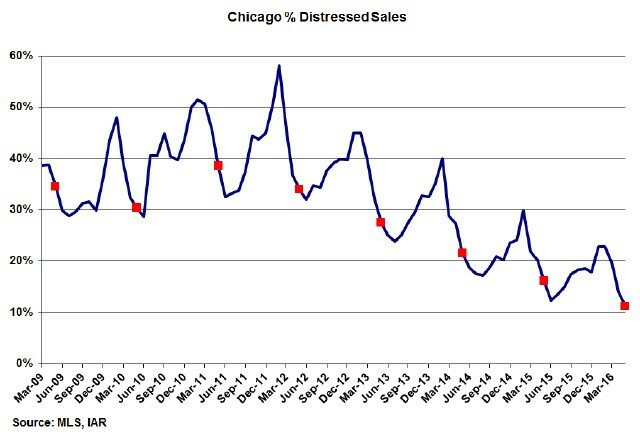
The percentage of distressed home sales continues to decline and hit new record lows. May came in at 11.3% vs. 16.2% last year. Back in the day distressed home sales clearly represented a huge share of the market and helped support the paltry sales that we had back then. But clearly the market no longer needs that source.
Chicago Home Inventory
Geez…there’s just not a lot for sale out there – or at least what hits the market sells really fast. The months of supply of homes for sale just keeps hitting new record lows. Detached homes ended May with a meager 3.9 month supply of homes, which was down from 5.3 months last year. Meanwhile, the months of supply of attached homes (condos/ townhomes) for sale was even lower at 3.0 vs. 4.2 last year. So…imagine what sales would be like if there was actually more for sale.
But, as with most things in life, individual results may vary. As I’ve mentioned previously detached homes in Lake View and Uptown are in a counter-trend.
Chicago Home Sale Market Times
With inventory so low and anecdotes of homes selling in days or just a couple of weeks you would think that average market times would be dropping like a rock. Well…they are and they aren’t. We are definitely seeing a healthy decline in how long it takes to sell attached homes, which sold in 65 days on average in May compared to 76 days last year. However, detached homes actually took a tad longer to sell in May than last year – 92 vs. 91 days. But both of these numbers are (or are close to) 9 year lows – and certainly a heck of a lot better than at the depths of the market in 2010 – early 2012.
#RealEstate #ChicagoRealEstate
Gary Lucido is the President of Lucid Realty, the Chicago area’s full service discount real estate brokerage. If you want to keep up to date on the Chicago real estate market, get an insider’s view of the seamy underbelly of the real estate industry, or you just think he’s the next Kurt Vonnegut you can Subscribe to Getting Real by Email using the form below. Please be sure to verify your email address when you receive the verification notice.

