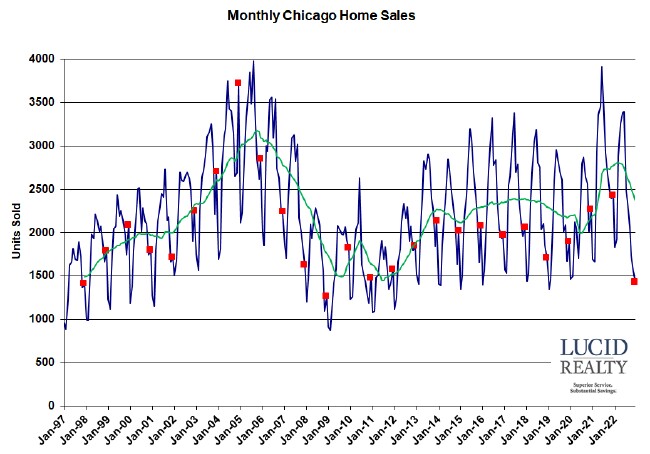
The Chicago real estate market has gotten so bad that we’ve gone from setting 11 year record low sales rates to setting 14 year record lows. Check out the butt ugly monthly sales graph below along with its 12 month moving average in green. December home sales were down 40.4% from last year, which also happens to be the biggest percentage decline since I’ve been tracking the data – with the exception of when the pandemic first hit. The sales decline was equally driven by declines in both detached and attached home sales.
In about two weeks the Illinois Assocation of Realtors will release the official numbers, which will appear to be a tad worse with a 41.2% decline.
Chicago Home Contract Activity
Looking at what’s going on with contract activity it’s clear that the situation is not going to improve any time soon. December also set a 14 year low in contracts written, down 35.7% from last year. That’s just a little better than the November decline of 42.6% so realtors are peeing in their pants.

Pending Chicago Home Sales
The other grim indicator is pending home sales – how many homes are in the pipeline, under contract, waiting to close. The graph below shows just how bleak the picture is. The December pipeline was lower than last year by 1234 units, which is a 43% decline. So January closings are likely to be down about 40% from last year.

Distressed Chicago Home Sales
Given the low level of foreclosure activity and delinquent mortgages and the high equity positions of homeowners we have not been expecting much of an increase in the percentage of home sales that are distressed. Nevertheless, it is ticking up – a bit more than I expected. 4.0% of December home sales were distressed compared to 1.9% last year. It’s also a bit higher than December 2020 but that benefited from the Covid foreclosure moratorium.

Chicago Home Inventory
The inventory of homes for sale in Chicago has definitely risen – in months of supply terms. I’m still doing my own calculation, using contracts written in the denominator and on that basis we now have a 4.7 month supply of attached homes for sale, up from 4.0 months a year ago. That’s still at the lower end of the historic range but it’s more or less a balanced market for buyers and sellers. Similarly, the inventory of detached homes rose to a 4.5 month supply in December, compared to a 3.2 month supply last year – a much bigger increase than we saw for attached homes. But the bottom line is that higher inventory levels definitely indicate a weaker Chicago real estate market and suggest that prices will fall.

Chicago Home Sale Market Times
The amount of time it takes to sell a home in Chicago has been on the decline for years. However, now, with higher inventory levels and lower sales, we are starting to see longer sale times – at least with detached home sales which now take 67 days on average, up from 53 days a year ago. Oddly enough though, attached home sales happened faster in December – down to 80 days from 94 days last year. I would think that this pattern will reverse very soon.
