In my Chicago real estate market update for February (on Monday) I repeated the well worn refrain that home inventory continues to hit new and ridiculous lows. However, as you know from reading this blog, averages can be very misleading and the home inventory situation is a perfect example. It turns out that the inventory of single family homes is actually rising in two very popular community areas – Lake View and North Center. And notice that I said single family homes, since this is clearly not happening with condos and townhomes.
I haven’t checked all 77 community areas to find out which ones show rising home inventory but these two pop out right away because they are so popular and other popular ones – e.g. Logan Square, Lincoln Park, West Town – are not demonstrating this phenomenon. I’ll let you follow the North Center link above on your own to see what is going on there but let’s take a closer look at Lake View where the impact is more dramatic.
Single family home inventory in Lake View actually bottomed at a 2.7 month supply in March and April of 2013 when the market was pretty hot. Since then it has been on an upward trend and hit a new recent record level of a 7.3 month supply for February, which is technically a buyer’s market. Imagine that!

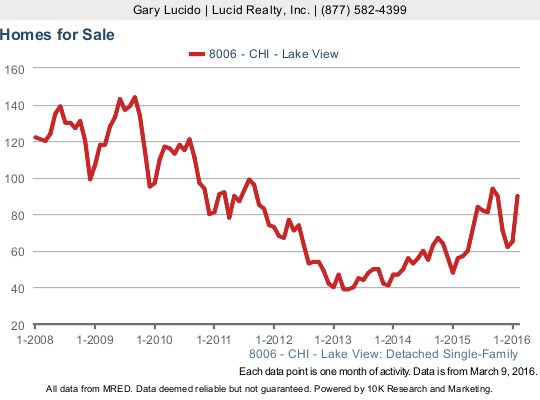
So what’s driving all this? Since there are only two numbers in the calculation the culprit either has to be more homes on the market or lower sales or some combination of both. Well, unless you want to see a very boring chart that shows no change in the sales volume just take my word for it that sales have not slowed down. Apparently, more people want to sell these days as dramatically shown in the graph below. At the end of February 2013 there were only 47 single family homes for sale in Lake View. At the end of last month there were 90 homes for sale – almost twice as many.
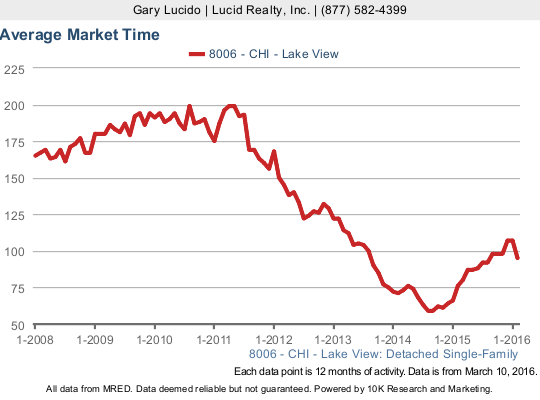
As you would expect in such a market environment it’s taking longer to sell these homes. The individual month data is pretty variable so to smooth it out I’ve used a 12 month moving average in the graph below. The average market time for homes that sold hit a record low of 59 days for the 12 months ending in August and September 2014. For the 12 months ending in February the average market time was 95 days – a significant increase.
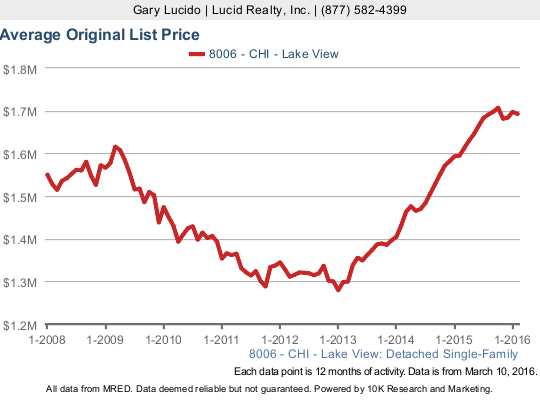
And now for the most dramatic graph – the trend in average list price. It has skyrocketed but keep in mind, as I often remind readers, this is not an indication of rising list prices but rather an increase in the mix of more expensive homes listed for sale. I don’t think it’s because sellers of the older homes are reaching for the stars (I can see that’s not the case by spot checking listings) but rather a flurry of construction of really expensive homes.
Again, in the graph below I’m looking at a 12 month moving average to smooth out the considerable noise in the data. Average list prices hit a low of $1.28 MM in January 2013. In February the 12 month average was $1.69 MM, which is near the high for the last 9 years.
Since new construction is such a big part of this story I’ll take a closer look at it during my annual review of new construction in Chicago.
#ChicagoRealEstate #Lakeview
Gary Lucido is the President of Lucid Realty, the Chicago area’s full service discount real estate brokerage. If you want to keep up to date on the Chicago real estate market, get an insider’s view of the seamy underbelly of the real estate industry, or you just think he’s the next Kurt Vonnegut you can Subscribe to Getting Real by Email using the form below. Please be sure to verify your email address when you receive the verification notice.


