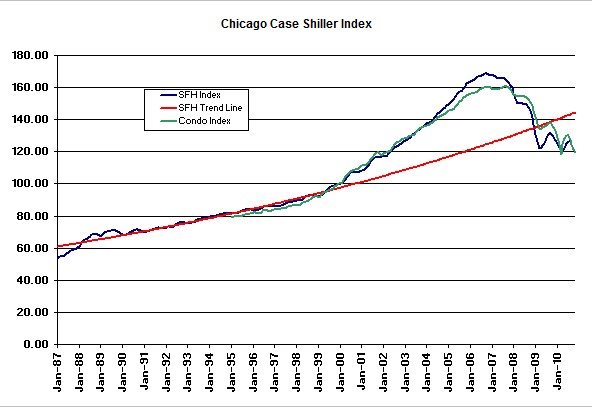
It was inevitable. With Chicago home sales at a standstill and 40%+ of all sales distressed the price declines continue. Case Shiller released their home price index for Chicago and other metro areas today and Chicago hit a new low – at least for single family homes. Condo prices are almost at a new low – maybe next month.
This index release is for November and, just a reminder, it’s a trailing 3 month average. Single family home prices fell an additional 2.2%, while condo prices fell an additional 1.6%. This brings single family home prices back to April/May 2002 levels and condo prices are back to March/April of that same year. Here’s a snapshot of where we are and where we’ve been.
Single family home prices have fallen 7.6% in just the past year and a total of 29.1% from the bubble peak. Meanwhile, condo prices have fallen a whopping 11.6% in the last year and 25.7% from the peak.
So where do we go from here? It’s bound to be a bit lower still. These are pretty big month to month declines that aren’t showing any immediate signs of slowing down. Case Shiller is still looking back through September in these latest numbers so we probably have at least 2-3 more months of declines ahead of us – maybe more. When the dust settles I could easily see another 6% of declines in store.
This puts the Chicago housing market in rather interesting territory. It’s way overshot the long run trendline on the downside – currently 17.3% below it. How low can it go?

Isn’t the trend line distorted though? It’s artificially high because of the bubble. If you extend out the line using the trend from 87-99 (pre-bubble), we’re just about intersecting it now. Of course, that doesn’t mean we won’t overshoot, but I’d say we are just starting to overshoot rather than being 17% under the trend line.
It turns out that I developed that trend line exactly from the data from 1987 – 1999 only. So I agree with you on your time frame! That’s what’s so compelling about believing that we’ve already overshot it.
Hmm, no kidding? I’m just holding a straight edge up to my computer screen (real scientific – ha) and it seems the line is bowing up a bit after ’99. Looking closer, I think I’m ignoring the lowish point in ’87 and the beginning of the uptick in ’99.
It’s a logarthmic regression, which is what you use to reflect constant growth rates. That’s why it bows up. On a logarithmic scale it’s linear.
Does the index account for the mix of property sizes? I wonder if smaller places are selling better now, reflecting therefore lower prices. When you advise clients on setting a price, what are you advising vis-a-vis recent comparables?
It’s not influenced by the mix of properties like the median price information that is thrown around by the industry. It is my understanding that the Case Shiller methodology is much more sophisticated. They look at the price changes of specific properties and then somehow average those. But it’s not like they are taking a simple average of the prices of homes sold. The mix of properties has definitely skewed to the lower end though and to the extent that those experience larger price drops it could pull the index down.
In terms of pricing properties I don’t really focus on the index. I look at the last 6 months of sales in the area for similar properties.
Good answer. What do you observe about the last 6 months of sales? I realize this depends on the property, but do you see what the Case Shiller index suggests in terms of dropping prices?
It would be difficult to see a price trend on such a small scale, so the answer is no. The variations between properties are usually much larger than the sort of price drop we would see over a 6 month time horizon. Even in a single high rise the condos can sell at widely different prices during a 6 month period. There is often not much of an explanation for the variation other than what some buyer is willing to pay and what a seller is willing to accept.