The media and real estate agents throw around Chicago median home prices like everyone is supposed to know what they mean but then they show their own ignorance when they imply that these median home prices somehow tell us all what is happening to the overall level of Chicago home prices. It would be really convenient if this were correct because median home prices are easily calculated at whatever level of geographic detail you would like. Unfortunately, life and real estate are not that tidy.
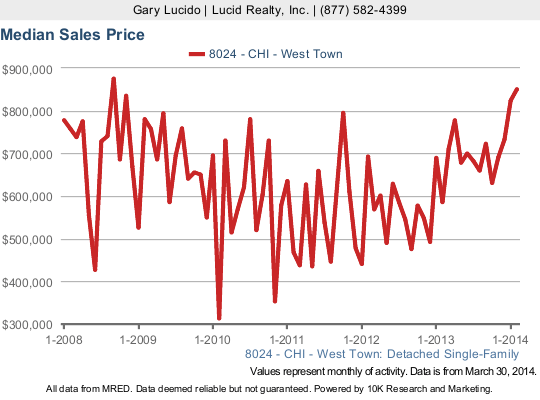
The best way to explain the subtle confusion going on here is with a simple example. As I recently pointed out in my post about Chicago’s 4 Hottest Neighborhoods For Single Family Homes, West Town has seen a rapid increase in average selling prices over the last year. Well, it’s also true that it has seen a rapid increase in median home prices, which have risen by 45.3% in the last year.
As you can see in the graph below there is a lot of volatility from month to month in these values and that’s why the graphing tool allows you to smooth the data out by averaging the values over 12 months. That’s what I did in my post on the hottest neighborhoods. But obviously looking at these small data sets causes one obvious problem. Pick a different starting and ending point and you will end up with a dramatically different percentage change.

But the other problem is a bit more subtle. First let’s make sure we all understand the definition of median home prices.
Definition Of Median Home Prices
When someone talks about median home prices what they are really talking about, whether they know it or not, is the midpoint of a group of data points. In other words half of the data set would be above this point and half would be below it – by definition. And the data points in this particular case would be actual home sales. The problem with actual home sales is that when you compare two particular time periods there is no guarantee that the homes sold in those two time periods are comparable. They can be wildly different – and often are when we see these huge swings.
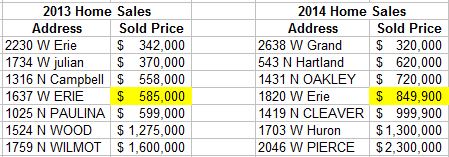
Let’s look at the underlying home sales from February 2013 and February 2014 that gave rise to the incredible 45.3% increase noted above. As you can see in the table below there are only 7 sales in each of the time periods, so it’s a pretty small sample size. Also, I’ve highlighted the median values for 2013 and 2014 and the median values indeed went up by 45.3%.
However, comparing these two unrelated sales tells us nothing about the overall level of home prices in West Town and anyone who attempts to draw those types of conclusions from this data should be taken to the woodshed. 1637 W Erie is a 4100 sq ft house that was built in 1999 on a 24 x 70 lot with nice finishes. 1820 W Erie was just rehabbed – inside and out on a standard sized lot and it’s 3100 sq ft. The inside must have been amazing to get this price (personally I think someone overpaid). The thing is that the 2014 median could have just as easily been a $998,000 home or a $721,000 home. There is nothing to relate it to 1637 W Erie that sold in 2013.
Don’t get me wrong. I think there is a place for median home prices. I think in a large enough data set it gives you a good idea of what is transpiring in the neighborhood – i.e. how is the mix of what is selling changing. But it tells you nothing about the overall price level. Just because nicer homes are now selling doesn’t mean that home prices went up.
If you want to keep up to date on the Chicago real estate market, get an insider’s view of the seamy underbelly of the real estate industry, or you just think I’m the next Kurt Vonnegut you can Subscribe to Getting Real by Email. Please be sure to verify your email address when you receive the verification notice.
