Everyone knows that the Chicago real estate market has come roaring back. Prices are up, sales are up, and the mix of distressed property sales is way down. In particular, it’s the dramatic decline in sales of distressed properties that would lead you to believe that we have mostly recovered from the housing bubble meltdown. Just check out the 4th graph on my October Chicago real estate market update from Monday.
The only catch is that we know better than to believe that the recovery has been uniform across the city. So just how disproportionate has it been? I tried to answer that by looking at the percentage of distressed sales by zip code for October – only where I had at least 10 closings to work with. I produced the heat map below where dark blue is essentially zero distressed sales and dark red is close to 60%. You can click on that map for a larger version (you may need to click again on the image that loads to expand it to its full size.)
It’s really no surprise that areas on the south and west sides are still mired in the aftermath of the housing bust while areas close to downtown and on the north side seem to be pretty much out of the woods. And of course Kenwood and Hyde Park are oases in what is otherwise a desert of foreclosures and short sales.
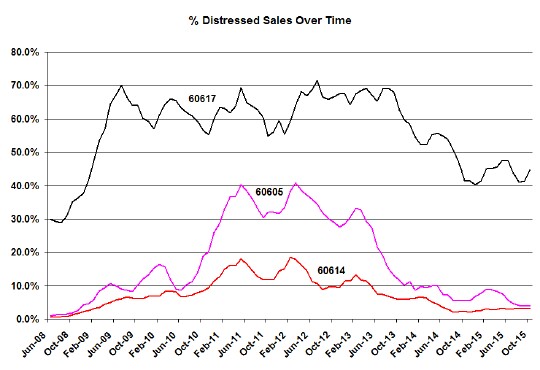
However, I was wondering how this picture has changed over time. How bad did it get in the areas that are now fine and how much have things improved in the areas that are still troubled? So I picked 3 zip codes that cover the gamut to examine over time. I looked at that deeply red zip code in the lower right corner of the map – 60617 – and 60614, which is essentially Lincoln Park with very few distressed properties selling right now. And then I picked 60605, which is essentially the South Loop and has fallen somewhere between the other two zip codes historically. Because the data is highly variable from one month to the next I looked at a 6 month moving average and plotted the results in the graph below.
First, please note that I don’t trust the early data in these time series because I believe there was a time when the MLS did not capture whether or not a sale was distressed. But I could be wrong.
Anyway, you can clearly see the different patterns in these 3 zip codes where distressed sales in 60617 rose much sooner and peaked much higher than the other two zip codes and is still way higher. All 3 zip codes have improved dramatically beginning in 2013 and 60614 always fared better than the other two zip codes, never rising above 20% distressed sales. And 60605 started out and has ended in line with 60614, though it peaked much higher than 60614.
In hindsight none of this is really a surprise but it really drives home the point that the Chicago housing market has not improved uniformly across the city and some areas are still deeply in the red while others are pretty much out of the woods.
#realestate #chicagorealestate #foreclosures #shortsales
Gary Lucido is the President of Lucid Realty, the Chicago area’s full service discount real estate brokerage. If you want to keep up to date on the Chicago real estate market, get an insider’s view of the seamy underbelly of the real estate industry, or you just think he’s the next Kurt Vonnegut you can Subscribe to Getting Real by Email. Please be sure to verify your email address when you receive the verification notice.

