An updated version of this post with data through June 2016 appears here: Chicago’s Safest And Most Dangerous Neighborhoods: Assault And Battery.
I kicked off my series on Chicago’s dangerous neighborhoods with a focus on murder, which is probably most people’s top concern since most people would agree that the consequences are a bit more serious than getting your iPhone snatched. However, the next concern that people would have in selecting a neighborhood to live in would be how dangerous it is from a violent crime standpoint. Violent crime is broken down by the Chicago Police Department into 4 major categories:
- Murder
- Criminal sexual assault
- Aggravated assault/ battery
- Robbery
Here is what the trend in violent crime for Chicago looks like courtesy of FindTheBest:
I decided to focus on aggravated assault/ battery this time because there are far fewer cases of criminal sexual assault and…robbery…well maybe I’ll do that some other day. Now it’s not entirely clear to me what the difference is between assault and aggravated assault or battery – after all I would be pretty aggravated every time someone tried to hurt me – and it’s not clear what the difference is between assault and battery. However, the Chicago crime database distinguishes between them and it’s the aggravated flavor that the Chicago Police consider violent.
I’m sure that some realtors and those with social concerns are cringing at the thought of a realtor discussing this topic since, at first blush, it may seem to teeter close to the edge of steering. But lo, I am not offering an opinion here on which neighborhoods I feel are safe. I am merely publishing some interesting breakdowns of publicly available information from the City of Chicago Data Portal and discussing some of the considerations in interpreting that data. And as I have pointed out in the past, interpreting this data is harder than you would think and can result in some surprising conclusions.
Aggravated Assault/ Battery In Chicago
I pulled data from June 26, 2012 – June 25, 2013. About 1/4 of the reported cases during that time period involve domestic violence. Although domestic violence is a great tragedy I decide to leave that out of my analysis because when someone is trying to decide whether or not they want to buy a home in a neighborhood they aren’t really focused on what is going on inside the houses down the street. They really want to know if they are going to be in danger as they walk down the street. Yeah, there’s probably a correlation between the two but we have plenty of data on the direct danger to you so let’s focus on that rather than a proxy. The resultant data set included 10,257 reported cases of aggravated assault/ battery.
Which Neighborhoods Have The Highest Incidence Of Assault And Battery?
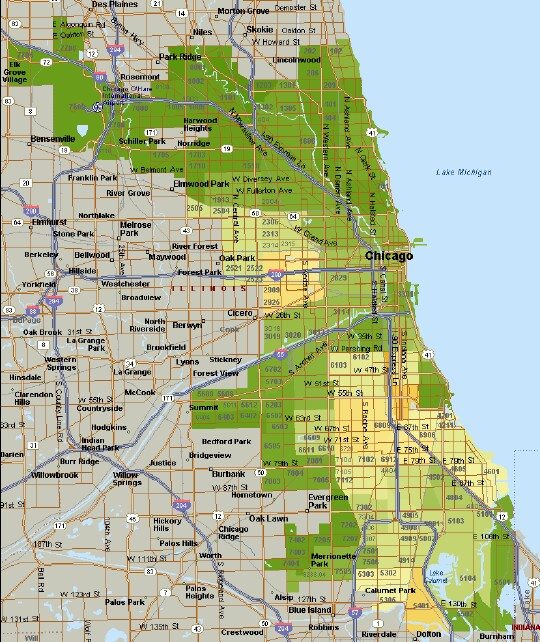
The first time I tried to analyze relatively safe and dangerous Chicago neighborhoods I quickly determined that you can’t just focus on the absolute numbers of crimes committed because some neighborhoods are larger than others and have more people. You would expect them to be more susceptible to crime. Therefore, I decided to once again adjust for the population of each neighborhood by calculating the aggravated assault and battery incidents as a percentage of the total population in that neighborhood. I then created the heat map below which represents this percentage in different colors – dark green being at the low end of the scale and orange being at the upper end of the scale.
Well, you have to be careful in interpreting data like this because you can’t distill safe and dangerous down to a single metric. For instance the Loop ranks higher on the list than you might expect but that might be because there is a huge influx of people every day that don’t live there and they probably create many more opportunities for criminal acts.
Here is the underlying data I used to generate the map above. The index I created ranges from a low of 0.026% for Edison Park to a high of 1.704% for Fuller Park. Note that Fuller Park has a relatively small population so it doesn’t take a lot of criminal acts to boost their violent crime index.
Of course, there’s nothing like seeing the details so I’ve plotted all the aggravated assault and battery incidents where I had the actual location data – all 9,999 records – in the interactive map below. It’s a bit dense but I blew it up to a level where you can start to see the difference in the density of these crimes as you pan the map around. Again keep in mind that high traffic areas are more likely to experience crime than low traffic areas. You can see this phenomenon in the map along certain sections of busier streets like Clark, Lincoln, or Milwaukee.
You can zoom in and pan directly in the map above and you can also click on any of the markers for more details. However, you can also access a larger version of this Chicago aggravated assault and battery map but you will need to give it some time to load – there’s a lot of data there. Next time I’ll provide a bit more of a profile of aggravated assault and battery in Chicago – when it is most likely to occur and how often it results in an arrest.
Gary Lucido is the President of Lucid Realty, the Chicago area’s full service discount real estate brokerage. If you want to keep up to date on the Chicago real estate market, get an insider’s view of the seamy underbelly of the real estate industry, or you just think he’s the next Kurt Vonnegut you can Subscribe to Getting Real by Email. Please be sure to verify your email address when you receive the verification notice.
Delivered by FeedBurner
Please be sure to verify your email address when you receive the verification notice.
