This is one of those blog posts where I think I know what I’m going to say but then I end up saying something totally different. I decided to take a different look at when is the best time to buy or sell a home in Chicago. In the past I’ve looked at this in terms of when you can get the best price as a home buyer or a seller based upon the Case Shiller home price index – the seasonality is fairly significant. What I haven’t done before is look at the factors that might drive that seasonality, which basically comes down to the balance of supply and demand for homes. And looking at the problem in terms of supply and demand might actually be a bit more intuitive to buyers and sellers and enable them to better optimize their timing.
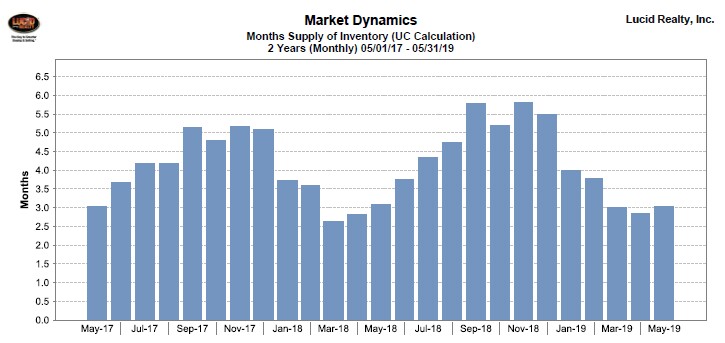
If the supply and demand for homes was perfectly balanced all the time there would be no seasonality in pricing. So let’s take a look at what really happens each year. The graph below shows Chicago’s home inventory in a way that I don’t normally show it. It calculates months of supply based on the number of contracts written during the month – supply relative to demand. And you can clearly see from this graph that supply is high relative to demand from September – December. In other words it’s really hard to sell your home during that time period but it’s a great time to buy. And it’s just the opposite from March – May. In fact, March is probably the best time to be on the market. These patterns roughly correspond to what we see in pricing.

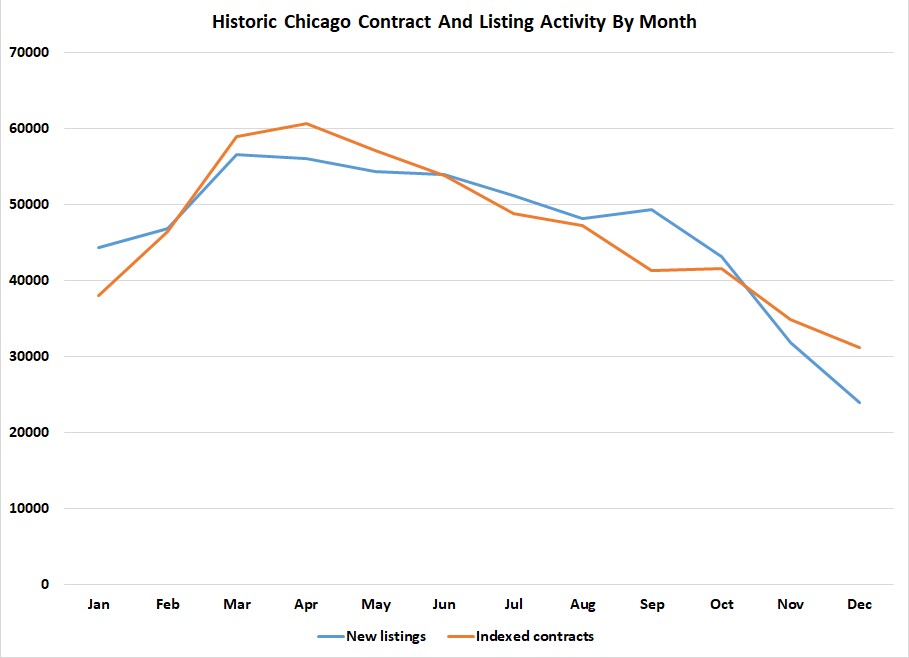
But I can’t leave well enough alone so I also looked at new listing activity vs. contract activity. My sense was that contract activity peaked early in the year but that listing activity peaked later. So I pulled the data going back to 2008 and summed it all up by month.
The first thing I noticed was that the number of new listings each month is roughly twice as high as the number of contracts written. How is that possible? Wouldn’t that produce a glut of homes on the market? Obviously not. A lot of listings expire each month or get cancelled. And some of these come back as new listings but they really don’t increase supply. But, nevertheless, there is more than enough supply to cover demand except that a lot of the supply is the wrong supply. Home buyers are turning their noses up at these homes at the prices offered and that’s why so many listings expire and get cancelled.
I wanted to compare the number of new listings to the number of contracts written to see if the seasonal patterns were mismatched. However, given the dramatic difference in the numbers, I needed to scale the contract activity up to put the two measures on the same scale. The result is in the graph below and it was not exactly what I was expecting. Listing activity and contract activity actually line up surprisingly well. This is why it’s always important to actually look at the data.
There is a little bit of a mismatch though along the lines I expected. Listings seem unusually high relative to contract activity in January (didn’t see that one coming) and in the summer. These would be better times to buy new listings. Listing activity is low in March and April and then again in November and December (didn’t see that one coming either though nobody wants to be on the market during the holidays). So these would be better times to sell new listings.
Of course this analysis just looks at new listings coming on the market and obviously home buyers also have their pick of existing listings as well. But the fact that contract activity lines up so well with listing activity kind of suggests to me that home buyers are more interested in the new listings than the old listings. If that’s the case then we would expect market times (remember…the time it takes for properties that sell to sell) to follow the inverse of the pattern above. And that’s pretty much the pattern we see below except it’s shifted by a month or two because there is a one to two month lag between when contracts are written and when the deals close. So, for example, peak contract activity occurs March – June with plenty of fresh listings on the market and then May – August market times are down.
So there is a corollary to all this that pertains to stale listings. It might not be as easy as you would think to sell them when the market is peaking in March – June because of all the new listings hitting the market. But later in the year, when nobody is listing, you’ll have a better chance.
#HomeSelling #HomeBuying #ChicagoRealEstate
Gary Lucido is the President of Lucid Realty, the Chicago area’s full service real estate brokerage that offers home buyer rebates and discount commissions. If you want to keep up to date on the Chicago real estate market or get an insider’s view of the seamy underbelly of the real estate industry you can Subscribe to Getting Real by Email using the form below. Please be sure to verify your email address when you receive the verification notice.
