There are a few statistical measures that realtors use to monitor the condition of real estate markets. Two of these measures are months supply of home inventory (how many months it would take to sell off the current inventory at the current sales rate) and market time (how many days homes have been on the market). Seems simple enough, right? Not so fast. Believe it or not there is plenty of room in defining these measures to make them look either better or worse.
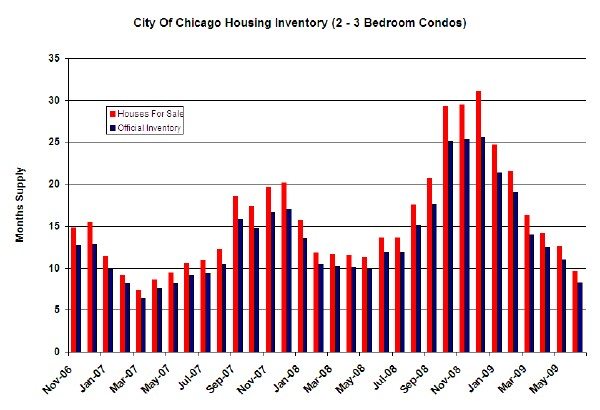
Let’s start with months supply of home inventory. Realtors have access to a statistical tool that conveniently spits out months supply of inventory for just about any slice of the Chicago real estate market you might want. However, for purposes of this “official” calculation the tool starts with the number of homes on the market at any time during the month and then reduces that number by the number that went under contract during the month and the number of listings that expired. I guess the rationale for doing it this way is that this represents how many homes remain to be sold. The only problem with this approach is that expired listings were part of the overhang that needed to be absorbed during the month. The fact that sellers gave up on them doesn’t make that housing supply go away. Therefore, I think it’s appropriate to include them in the calculation. The graph below compares the two approaches for measuring months supply of condo (2 – 3 bedrooms) inventory in Chicago. As you can see, the more comprehensive measure is always larger than the official numbers – especially in the fall.
BTW, you will notice that the June home inventory level for Chicago is actually lower than last year for the first time in over a year.
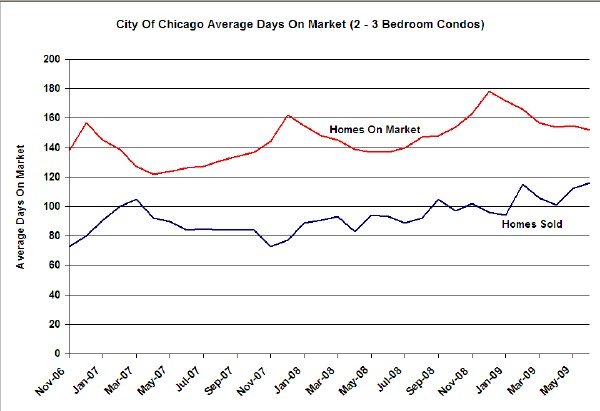
Then there’s the market time. The real estate industry’s official measure of market time is based upon the number of days that a home was on the market before going under contract. Therefore, it only measures the market time for homes that actually sold! So, it excludes all the homes sitting on the market unsold. Well, that seems sort of biased, doesn’t it – not that the real estate industry would ever want to paint a pretty picture of the real estate market? So I believe that it is more accurate to calculate the average market time of all homes – sold and unsold. This more accurately reflects the pain of home sellers. The graph below compares the market times in Chicago using the different methods. As you can see, it’s a fairly dramatic difference and the more comprehensive method also reflects the seasonality that you would expect to see in a measure like this.
Effective July 1, 2009 we have restated all of our statistics (current and historic) using these new methodologies. As always, you can find Chicago neighborhood specific real estate market data here:

