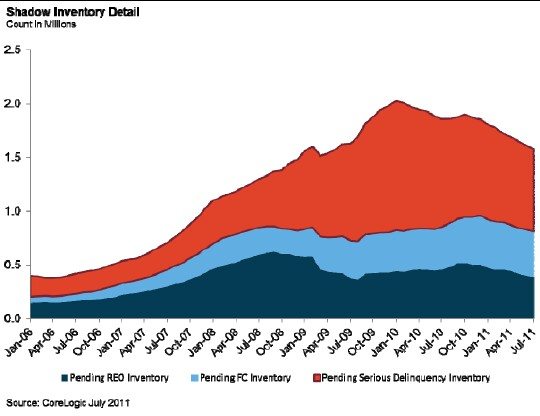
Many of the housing bears seem to obsess about the shadow inventory of homes that are out there just waiting to depress home prices even further. However, last week CoreLogic released their 2nd quarter report on the shadow inventory of homes and at the national level it showed a decline from 1.9 million units in July of last year to 1.6 million units this July. As they explain it the inventory is being disposed of faster than new delinquencies are materializing.
There are 3 components to the shadow inventory that are shown in the graph below:
- Bank owned (REO) properties (390,000)
- Properties that are in foreclosure (430,000)
- Seriously delinquent (90 days or more past due) properties not listed on the MLS (770,000)
Shadow inventory currently accounts for 29% of the total home inventory out there so it’s a significant overhang on the market.

As you can see the shadow inventory has been in decline since January 2010 when it peaked at 2 million units, which is a positive for home prices (if you are a seller that is). But before you get too excited consider what Mark Fleming, chief economist for CoreLogic, said, “The steady improvement in the shadow inventory is a positive development for the housing market. However, continued price declines, high levels of negative equity and a sluggish labor market will keep the shadow supply elevated for an extended period of time.”
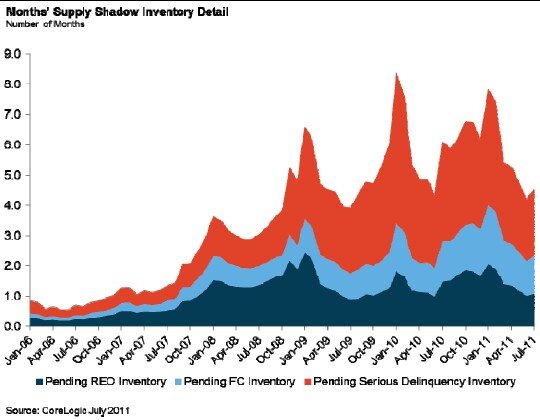
On a months of supply basis we are sitting at a 5 months supply compared to July 2010 when we were sitting at a 6 months supply. As you can see in the graph below the months of supply is highly seasonal, as sales fall off during the winter months. Months of supply also peaked in January 2010 at 8.4 months.
I wish I could tell you how the shadow inventory looks specifically for Chicago. However, CoreLogic does not provide that information. S&P does that analysis but they are no longer sharing that information publicly – you have to pay for it. In fact, they took down the last publicly available analysis that they had out on the Internet.
