While it is true that September clocked another impressive month of strong, double digit percentage growth in home sales in Chicago, it is looking more and more like the days are numbered for this kind of real estate market performance. After all trees don’t grow to the sky.
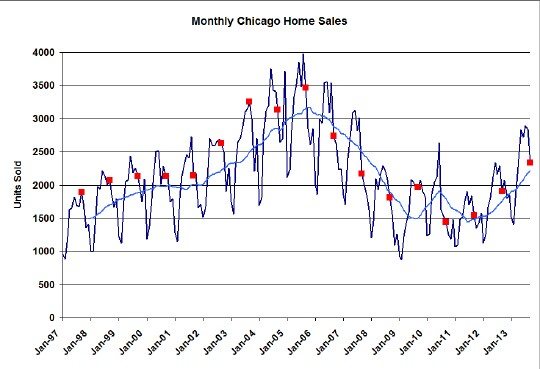
September was up 26.9% over last year, marking the 27th consecutive month of annual sales growth and, as you can see in the graph below, the 6th highest September sales in the past 17 years that I have monthly data for – somewhere between the sales level that we hit in 2001 and 2002, on the way up to the top of the bubble.
Look for the Illinois Association of Realtors to report a sales growth number closer to 22.8% because of their rather inconsistent way of making the year over year comparison. You can also look for their release to brag about the 24.2% increase in median Chicago home prices, which has nothing to do with the value of homes in Chicago and everything to do with the value of what is being sold.
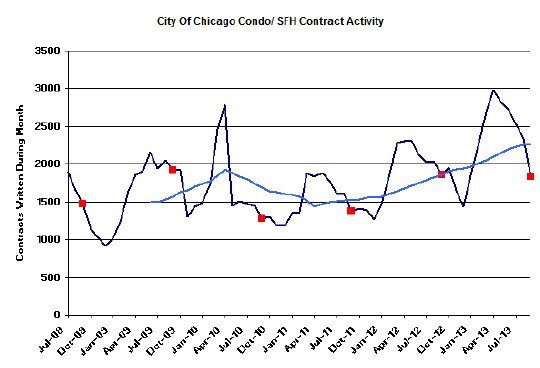
Chicago Home Contract Activity
So where is the fly in the ointment in the real estate market data for September? It’s in the contract activity. A number of people in the industry will tell you that things seem to have slowed down a bit in the last few weeks and now we have the data to corroborate that observation. I’m estimating that when the dust settles on the contracts originated in September we are going to see that activity actually declined slightly in September over last year. That would be the first decline in 29 months – to the tune of about 1%.
The immediate impact of the decline in contract activity is being seen on the number of pending home sales, which fell to 4956 units or a 2.1 month supply of closings at the current close rate. That’s 508 units less than last September and on the lower end of the months of supply range we’ve recently seen. In other words, it shouldn’t be too long before this shows up as reduced home sales (closings).
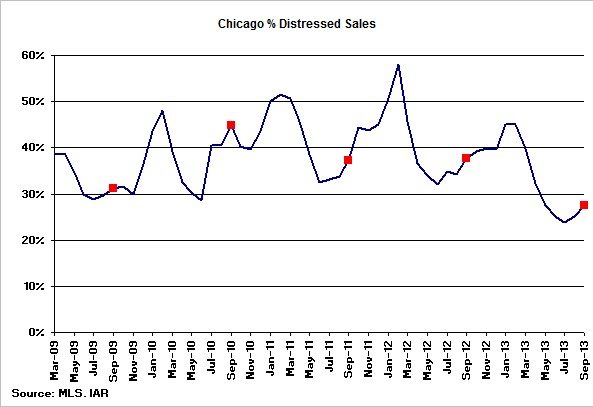
Distressed Home Sales
Continuing the recent trend of a declining percentage of distressed home sales, once again the percentage was at the lowest level of the last 5 years – 27.6%. But note that we are now in the time of year when, due entirely to seasonality, the percentage temporarily increases.
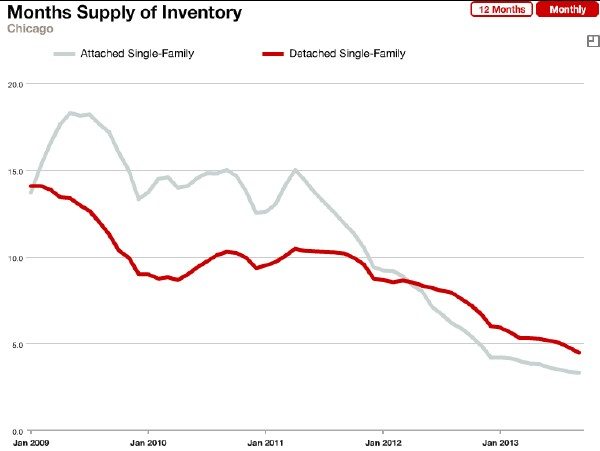
Chicago Home Inventory
Despite the reduction in contract activity the months of supply of homes is still at record low levels. For September there was only a 4.5 month supply of single family homes and a 3.3 month supply of condos and townhomes. The numbers still show a downward trend BUT each month the previous months’ numbers get revised upward as contracts fall apart, the curve seems to be flattening, and we are entering the time of the year where historically the months of supply rises.
What is interesting is that the months of supply of condos and townhomes is declining DESPITE the fact that there are actually 20% more new listings this year than last year. So demand has clearly outpaced the additional supply. As for single family homes…new listings have been about the same as last year so, while demand has still increased, it has not increased as much as the demand for condos and townhomes.
Chicago Home Sale Market Times
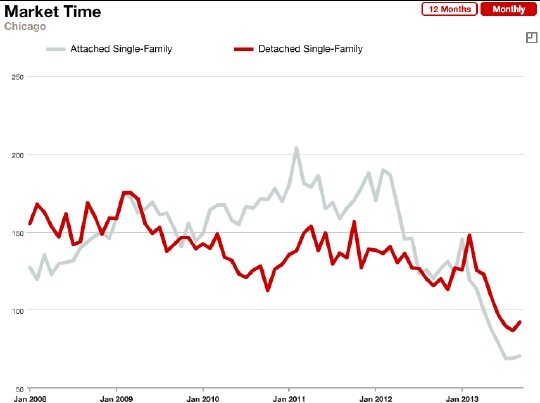
And you can see the trend starting to turn in the market time data below. Yes, it could very well just be random variation but I bet it’s not. In September single family homes that sold sold in 92 days while condos and townhomes sold in only 71 days, both of which are impressively fast and record lows for the last 6 years.
If you want to keep up to date on the Chicago real estate market, get an insider’s view of the seamy underbelly of the real estate industry, or you just think I’m the next Kurt Vonnegut you can Subscribe to Getting Real by Email. Please be sure to verify your email address when you receive the verification notice.
