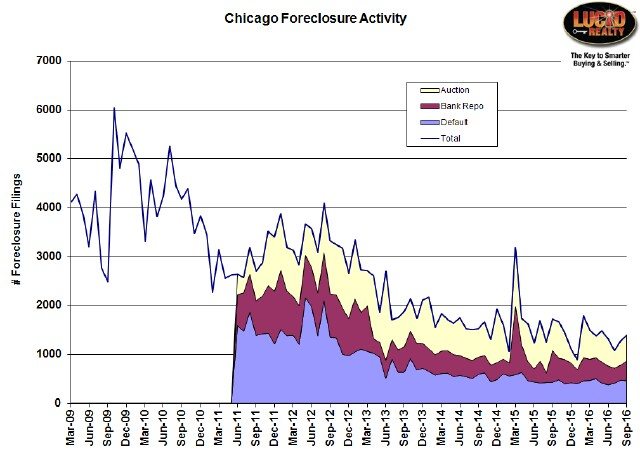
The RealtyTrac September and Q3 2016 Foreclosure Market Report was just released this morning, though I did not have access to the Chicago foreclosure activity data until the 19th of the month, at which time I updated this post with the graph below.
Foreclosure activity in Chicago ticked up again, though not significantly. There is a lot of volatility in the data as you can see so the September change was in keeping with that pattern. And…the increase was restricted to bank repossessions and auctions, which are at the end of the foreclosure pipeline. Defaults (blue area below) were down from last month, which is a good thing.
However, the overall foreclosure activity was once again up from last year – for only the third time in 4 years. That would seem to confirm that we’ve reached the bottom.
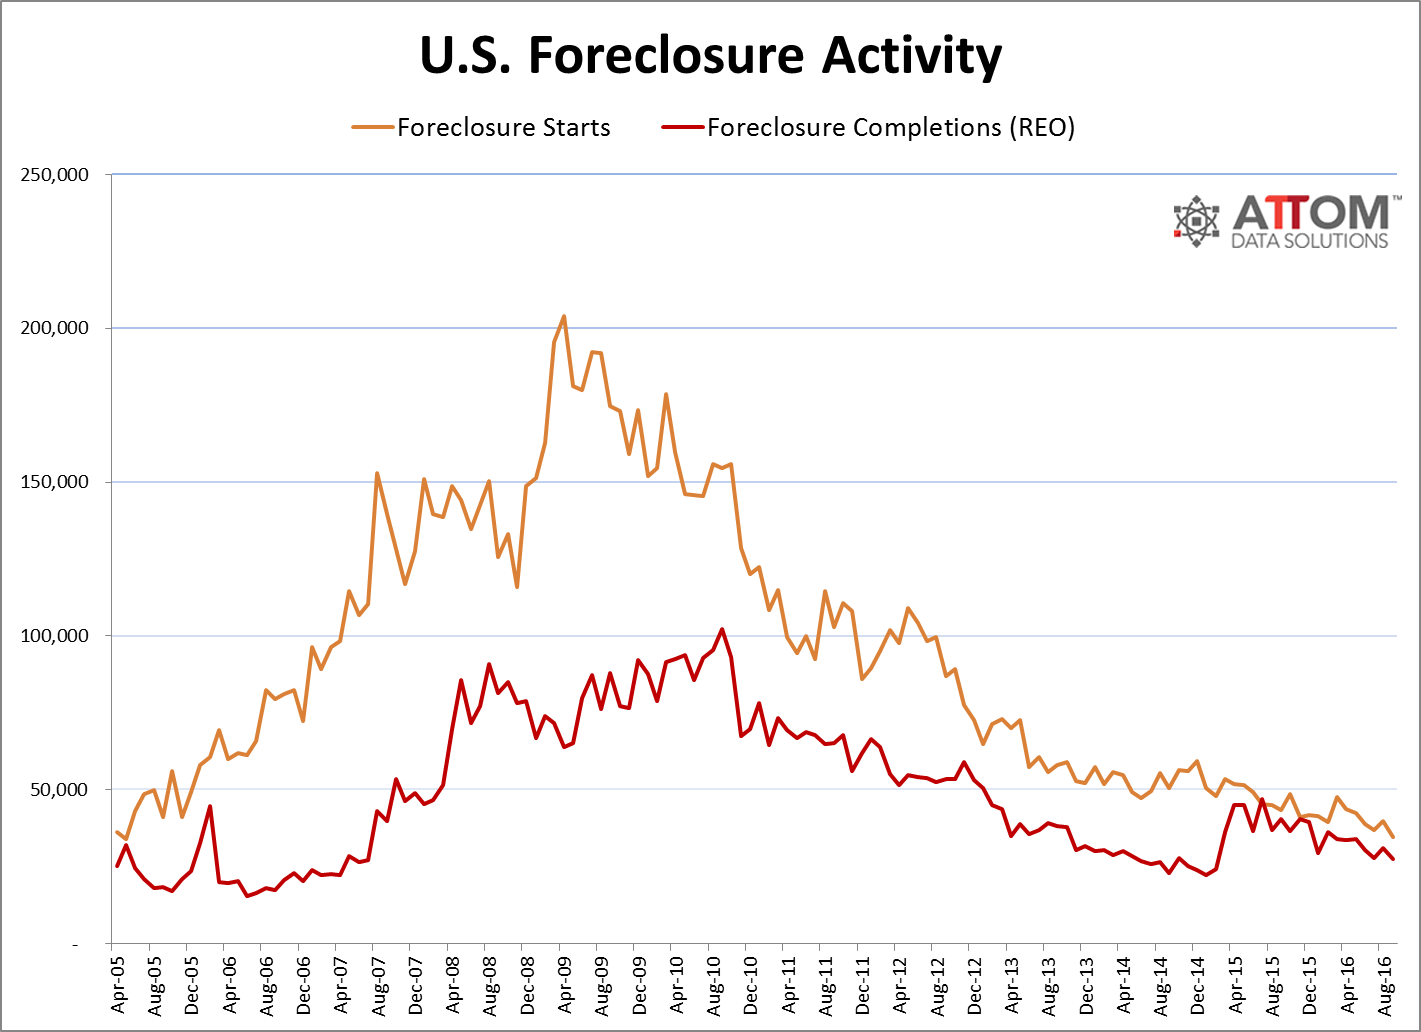
At the national level US foreclosure activity “was down 24 percent from a year ago to the lowest level since December 2005.” The graph below shows the trend in foreclosures going back to just as the housing bubble started to burst and you can easily see just how far we’ve come in cleaning up this mess. What’s interesting is that recently the foreclosure completions are more closely matching foreclosure starts, which is a good thing because that means that the backlog of foreclosures should not be growing. Note that the gap between the two really closed about a year and a half ago – something I noted at the time and which was really not explained to my satisfaction. To this day I think there was a change in the way the data was collected and this was not a real effect.
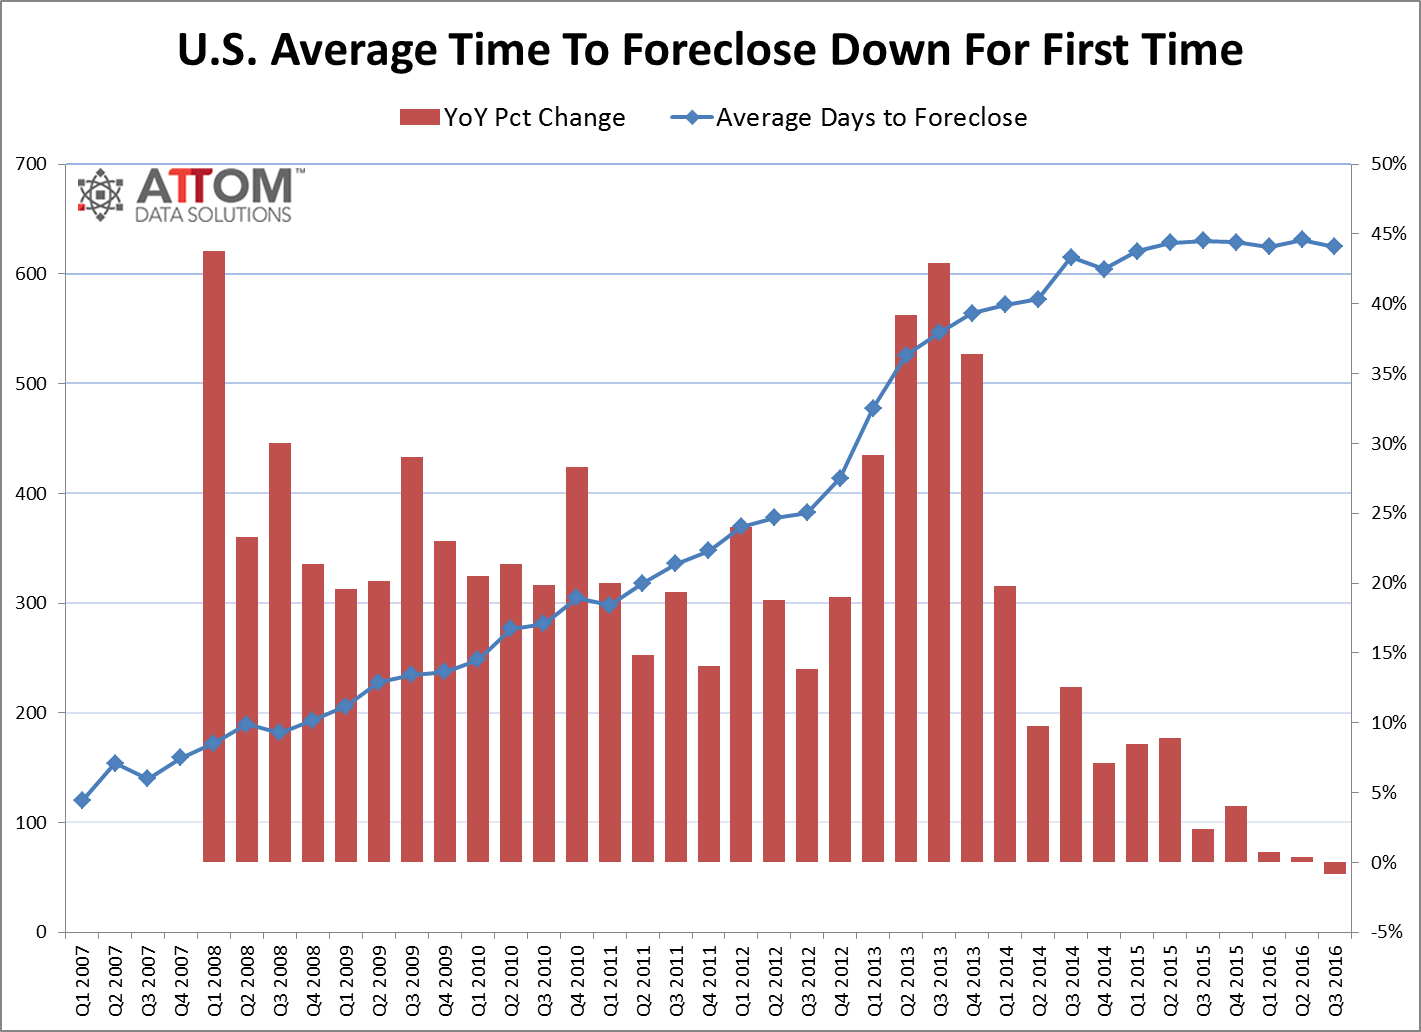
 Of course, the length of time it takes to complete foreclosures doesn’t help the backlog. During this entire ordeal it’s been increasing and only recently plateaued. In the third quarter it actually declined for the first time as you can see in the graph below. And guess what? Illinois has the 5th highest foreclosure time in the country – behind states like New York and New Jersey. This is a function of the legal environment so no surprise who is high on the list.
Daren Blomquist, senior vice president at ATTOM Data Solutions, the parent company of RealtyTrac, sees the decline in the timeline as an indicator of the end of – or at least a turning point in – the foreclosure crisis:
While we’ve known that the national foreclosure problem has been dying a long, slow death for quite some time, the final nail in the coffin of the foreclosure crisis is the year-over-year decrease in the average foreclosure timeline nationwide that we saw in Q3 2016 — the first time that’s happened since we began tracking foreclosure timelines in Q1 2007. The decrease in the average foreclosure timeline indicates that banks have worked through the bulk of the legacy foreclosure backlog in most states — with a few lingering exceptions — and that most of the foreclosures being completed now are relatively recent defaults that are more efficiently progressing through the foreclosure pipeline.
Chicago Shadow Inventory
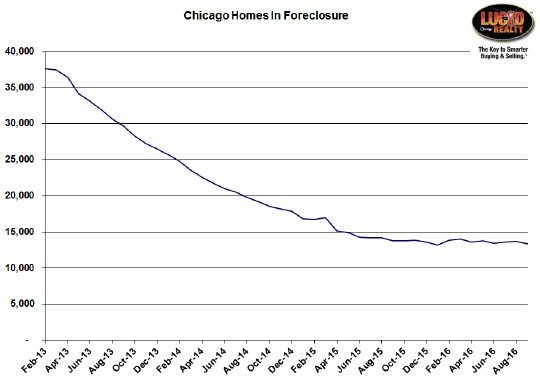
It’s hard to see in the graph below but the backlog of Chicago homes in foreclosure finally took a dip in September, hitting an 8 month low. As you can see this backlog really hasn’t done much in the last year so, hopefully, this will be the start of another move downward.
#Foreclosures #ChicagoForeclosures
Gary Lucido is the President of Lucid Realty, the Chicago area’s full service discount real estate brokerage. If you want to keep up to date on the Chicago real estate market, get an insider’s view of the seamy underbelly of the real estate industry, or you just think he’s the next Kurt Vonnegut you can Subscribe to Getting Real by Email using the form below. Please be sure to verify your email address when you receive the verification notice.
