Of course it was nice that this morning’s release of the Case Shiller home price index for September by S&P Dow Jones Indices showed Chicago home prices rising again in September but what was really great was seeing that the year over year price gains continue at a very strong pace. Compared to August single family home prices were up by only 0.3% but at this time of the year that’s pretty good even though it was actually below the median for the 20 cities tracked by the Case Shiller index. Meanwhile, condo prices were up 0.7%.
My long term graph of the Case Shiller indices for Chicago single family homes and condos is shown below along with the long term trend line in red. Single family home prices are back to March 2003 levels while condo prices are back to November 2002 levels – more than 10 years without a substantial net increase in home prices. But that is the highest price level for single family homes in 4 years and 3 years for condos.

From the lows of March 2012 single family prices have risen by 24.6% and condo prices have risen by 31.4%. Yet, single family home prices are still 24.1% below their peak level and 20% below the long term trend line. Condo prices are 20.6% below their peak level.
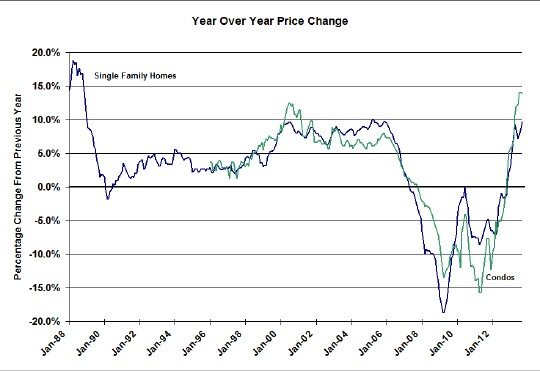
But the really great story is in the year over year comparisons, which have now been positive for 11 months straight. Single family home prices are up 9.7% from last year and condo prices are up 13.9%. For single family homes you would have to go back to the late 80s to find growth that strong and condo prices (which don’t go back as far) have only recently hit year over year growth levels that high. Yet, despite this good news, Chicago is lagging 12 out of 20 of the metro areas tracked by Case Shiller in year over year gains – by a lot in some cases. If Chicago ever catches up watch out!
Commenting on the national picture, David M. Blitzer, Chairman of the Index Committee at S&P Dow Jones Indices, said:
The second and third quarters of 2013 were very good for home prices. The National Index is up 11.2% year-over-year, the strongest figure since the boom peaked in 2006. The 10-City and 20-City Composites year-over-year growth at 13.3% was their highest annual numbers since February 2006.
Twelve cities posted double-digit annual returns. Regionally, the West continues to lead with Las Vegas gaining 29.1% year-over-year followed by San Francisco at 25.7%, Los Angeles at 21.8% and San Diego at 20.9%. San Francisco and Los Angeles showed their highest annual returns since March 2001 and December 2005. Although Chicago has not reached double-digit growth, the city recorded its highest year-over-year gain since November 2005.
The strong price gains in the West are sparking questions and concerns about the possibility of another bubble. However the talk is focused on fear of a bubble, not a rush to join the party and buy. Moreover, other data suggest a market beginning to shift to slower growth rather than one about to accelerate. Existing home sales weakened in the most recent report, home construction remains far below the boom levels of six or seven years ago and interest rates are expected to be higher a year from now.
Housing continues to emerge from the financial crisis: the proportion of homes in foreclosure is declining and consumers’ balance sheets are strengthening. The longer run question is whether household formation continues to recover and if home ownership will return to the peak levels seen in 2004.
To answer David’s longer run question…not only will home ownership not return to those peak levels but they shouldn’t. Those levels were aberrations resulting from a government and a financial industry trying to make everyone a home owner. It was a huge mistake as we all know now.
If you want to keep up to date on the Chicago real estate market, get an insider’s view of the seamy underbelly of the real estate industry, or you just think I’m the next Kurt Vonnegut you can Subscribe to Getting Real by Email. Please be sure to verify your email address when you receive the verification notice.
