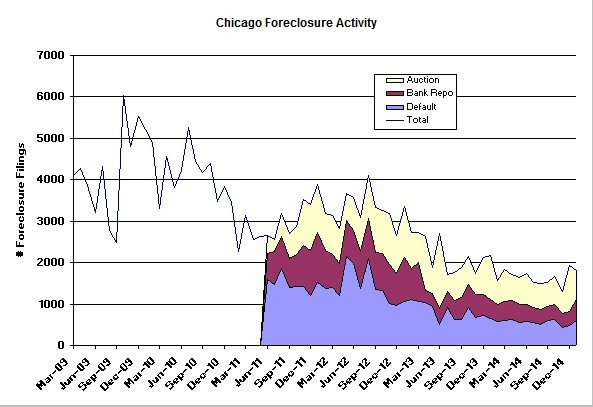
RealtyTrac released their January Foreclosure Market Report this morning and the Chicago foreclosure activity data remains at a level higher than most recent months. However, this seems to be mostly good news as we made considerable progress in working through our shadow inventory.
The graph below shows the long term trend in Chicago foreclosure activity and you can clearly see the spike that occurred in December and continues to a large extent in January. That increase is driven largely by increases in the rate at which the banks are dealing with the foreclosures – auctions and repossessions. Unfortunately, in January there was also an increase in the rate of defaults in Chicago, which is refilling our foreclosure pipeline.
At a national level bank repossessions hit a 15 month high, which RealtyTrac sees as a sign of lenders cleaning house. You can see the long term trend and the recent spike in bank repossessions in their graph below.
Chicago Shadow Inventory
But when you look at Chicago’s backlog of foreclosures, or shadow inventory as it’s known, in the graph below you see that there was a larger decline in this number than in recent months. Whereas recent months have been declining by about 300 – 600 units, January declined by 1100 units. It seems as though the banks rushed to finish some of these off before the end of the year.
BTW, back in October the shadow inventory reached 50% of what it was when I first started tracking this metric in February 2013.
#realestate #chicagorealestate #foreclosures
If you want to keep up to date on the Chicago real estate market, get an insider’s view of the seamy underbelly of the real estate industry, or you just think I’m the next Kurt Vonnegut you can Subscribe to Getting Real by Email. Please be sure to verify your email address when you receive the verification notice.


