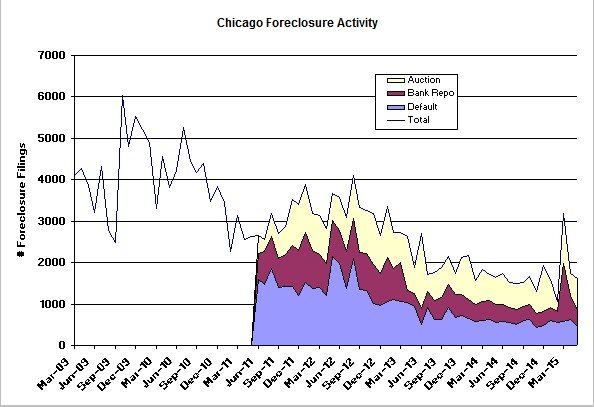
I think the decline in Chicago foreclosure activity has really run it’s course. RealtyTrac released their May Foreclosure Market report this morning and I’ve updated my graph with their data below. There has been a lot of volatility in the numbers lately but May is basically flat to last year – actually it’s down by about 1%, which is not significant. And you can see how the lines below have basically treaded water lately. The good news is that the default numbers are down a bit and they represent the front end of the foreclosure pipeline.
Regarding that spike we saw in March…I have a new theory on what happened there. RealtyTrac started getting data from a new provider in the first quarter. That provider had more timely information than the previous providers, which would accelerate the reporting of foreclosures. I think what happened is that when they switched a bunch of foreclosures got pulled into that month that would have normally been reported in later months.

Daren Blomquist, vice president at RealtyTrac, provided the following perspective on this month’s release. He also mentions the lower level of defaults at the national level.
May foreclosure numbers are a classic good news-bad news scenario, with the number of homeowners starting the foreclosure process stabilizing at pre-housing crisis levels but the number of homeowners actually losing their homes to foreclosure still well above pre-crisis levels and on the rise. Lenders and courts are pushing through stubborn foreclosure cases that have been languishing in foreclosure limbo for years as options to prevent foreclosure are exhausted or left untapped.
Chicago Shadow Inventory
Looking at the number of Chicago homes in the foreclosure pipeline we see that the decline is also flattening out. Basically that means that we’re really no longer clearing the pipeline faster than new foreclosures are entering the pipeline.
10 Markets With Greatest Drop In Home Prices
RealtyTrac also released a report called Top 10 Housing Markets with Home Prices Furthest Below Pre-Crisis Peaks. It includes Chicago as #10 on the list. Pay no attention to the report behind that curtain simply because it’s apparent that their analysis is based upon median sales prices, which I have discussed on numerous occasions as being a totally bogus measure of home prices. To review…it is greatly affected by the mix of homes sold so it doesn’t really reflect “prices”.
#realestate #chicagorealestate #foreclosures
If you want to keep up to date on the Chicago real estate market, get an insider’s view of the seamy underbelly of the real estate industry, or you just think I’m the next Kurt Vonnegut you can Subscribe to Getting Real by Email. Please be sure to verify your email address when you receive the verification notice.
