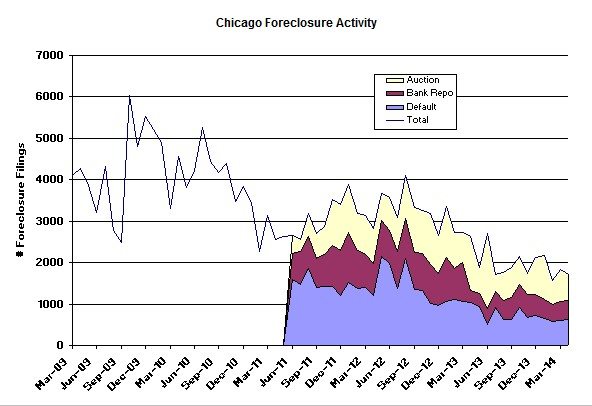
RealtyTrac released their April foreclosure market report this morning and frankly I’m finding the data to be more and more boring each month – especially as you compare April to March. The only real change from March to April was in the 16% drop in auction activity and even that is not particularly interesting given the large variations that often occur from one month to the next. When you look at the graph below it’s clear that activity is really bottoming out. The big driver of this is the thankful decline in defaults since that’s what feeds the pipeline.
Chicago Shadow Inventory
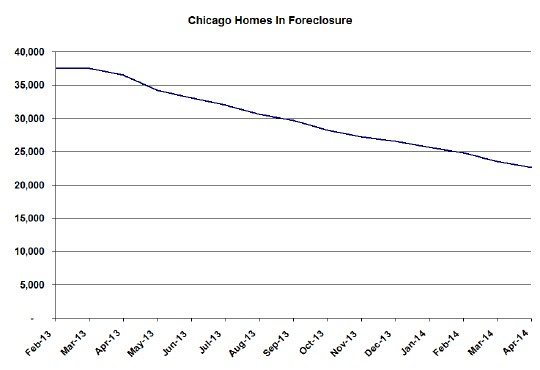
What really matters at the end of the day though is how many homes in Chicago are in some stage of foreclosure and that number continues to steadily decline at a rate of about 1000 per month as shown in the graph below. With fewer mortgages in default you would expect that result and that explains why we are seeing a smaller and smaller percentage of distressed properties in the sales numbers.
This month I noticed that the decline in homes that are in the foreclosure process is greater than what you would expect from looking at the data above: 1000/ month vs. 600 – 700 going to auction each month. How do we explain that? I think it has to be the fact that going to auction is not the only way for a property to exit the foreclosure process. There are short sales and some homeowners can even bring their mortgages current again. That has to be the explanation.
If you want to keep up to date on the Chicago real estate market, get an insider’s view of the seamy underbelly of the real estate industry, or you just think I’m the next Kurt Vonnegut you can Subscribe to Getting Real by Email. Please be sure to verify your email address when you receive the verification notice.

