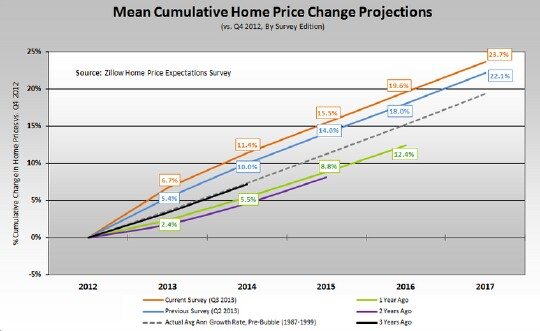
Once each quarter Zillow sponsors a Pulsenomics five year home price expectations survey of a little more than 100 economists. The latest survey came out at the end of last week and, as with previous recent surveys, it shows increasing optimism for home price appreciation. The graph below sums up the current outlook and compares it to previous expectations. It’s hard to read but you can see the original at the link above.
The different colored lines represent the outlooks at different points in the past. They have been drifting upwards with each successive forecast and the orange line at the top is the most recent outlook. The numbers noted along the lines represent cumulative appreciation. So, the most recent forecast shows cumulative appreciation over 5 years of 23.7%, which works out to a tad over 4.3% compounded annually. With the interest rate on a fixed rate mortgage right around 4.3% recently that basically means that the annual appreciation would make up for the interest cost of the mortgage – and that’s before the tax benefit of the mortgage interest deduction. In other words, ignoring transaction costs, you could get your interest back in terms of your equity recovery when you sell your home.
However, the economists surveyed apparently did express a cautionary note about the recent rise in mortgage rates: “while relatively few respondents expressed concern about the impact of recent increases in mortgage rates, most believe that rates of 6 percent or higher would pose a significant threat to the housing recovery.” Pulsenomics® founder Terry Loebs went on to say that “nobody should dismiss the implications for the housing market of the less popular view – held by 38 percent of our experts – that we are already flirting with a reversal of fortunes at or within about 100 basis points of prevailing mortgage rate levels.”
But I will point out that the long run Case Shiller price index data does not show a correlation between mortgage rates and home prices. I know, that’s counter-intuitive but nevertheless true.
The Outlook For Chicago Home Prices May Be Best In Nation
Unfortunately, the Pulsenomics survey doesn’t really break down by metro area but it turns out that there is a pretty good perpetual forecasting machine out there for many of the Case Shiller home price index markets and the composite index as well. This forecasting machine is the futures market, which has been shown to do an extremely good job of forecasting the future prices of their underlying assets. (Don’t believe me? Then go ahead and try making money trading them with your superior knowledge of the future.) These Case Shiller indices are traded on the CME and you can check out the quotes for the Chicago index here: Chicago November 2013 Real Estate Futures quote. I picked November just as an example.
Here is what the market for the November contract is telling us. First of all the November contract is for the November release of the Case Shiller index, which will actually be the number for the 3 month average ending in September. Compare that to the last index we got from Case Shiller, which was for the month of May, which came in at 117.90. That November futures contract has a bid of 130.0 and and an ask of 131.8, which puts the mid-point at 130.9. That mid-point implies a price increase of 11% over the next 4 months! Cool, if you’re a homeowner but I do need to point out that prices always go up at this time of year. Last year saw a 7.4% increase in this same time period and the market is hotter this year than last.
If you find this whole discussion of the futures markets interesting check out John Dolan’s Home Price Futures blog. John is the sole market maker in these contracts so he has a worthwhile perspective on these contracts and the index. He recently contacted me and pointed out that the Chicago contracts are actually the most bullish of the top ten regions over the next few months. Who would have thought?
