I’m STILL not ready to declare that the Chicago Real Estate Market is slowing down despite the fact that October showed a continued decline in home sales from last year. The decline wasn’t that big – only 6.4% and once again pretty much entirely due to the decline in distressed sales. That decline is actually slightly smaller than September’s decline and about what I was expecting, given the contract activity we’ve been seeing.
As always I’m going to point out what the Illinois Association of Realtors will report in about 2 weeks: a decline of 8.3%. In addition, they will brag about the 8.9% increase in median prices, which is pretty much also attributable to the decline in distressed properties.
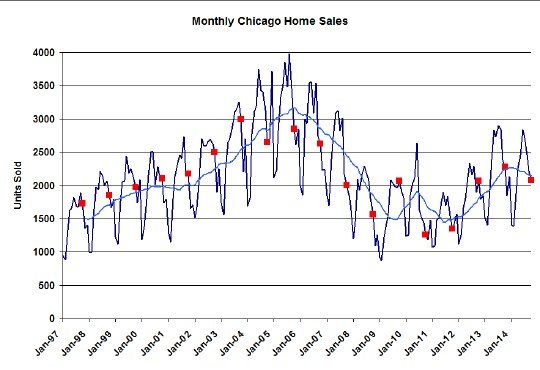
The graph below shows the monthly Chicago home sale history going back to January 1997 with all the Octobers flagged as red squares (but not the Moscow kind) and a blue moving average. This October comes in at second place over the previous 7 years and comes in pretty close to October 2000 when the bubble was just a twinkle in Fannie Mae’s eyes.
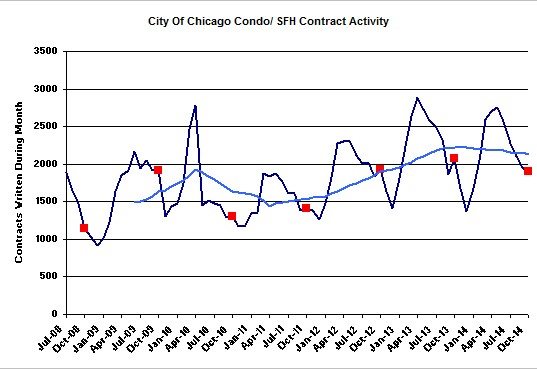
Chicago Home Contract Activity
The number of contracts written in Chicago during October continues on the path of slight declines, which portends that home sales are pretty much going to continue to be soft to the same degree they have been. Contract activity was down 8.6% in October, in line with previous months.
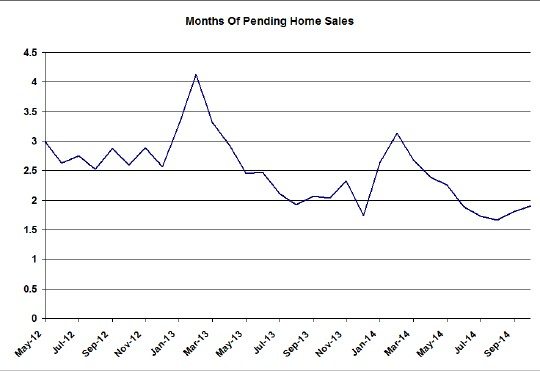
Pending Home Sales
I also track pending home sales, expressed in terms of the months of supply of closings since these feed future closings. As you can see in the graph below pending home sales are running lower than last year – but only a bit. So I don’t expect huge changes in the sales rate over the next couple of months. We’re currently running at a 1.9 month supply, down from last October’s 2.0 month supply.
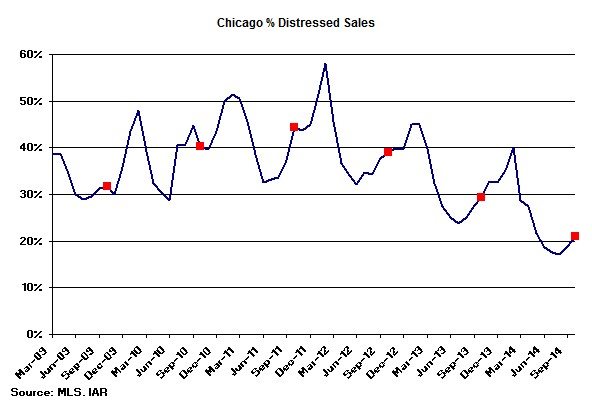
Distressed Home Sales
The percentage of distressed sales continues on a downward path as we work through the backlog of underwater properties. This decline is what is really behind the overall decline in sales and the increase in median sales prices. In October only 20.9% of the sales were distressed compared to 29.5% last year.
Chicago Home Inventory
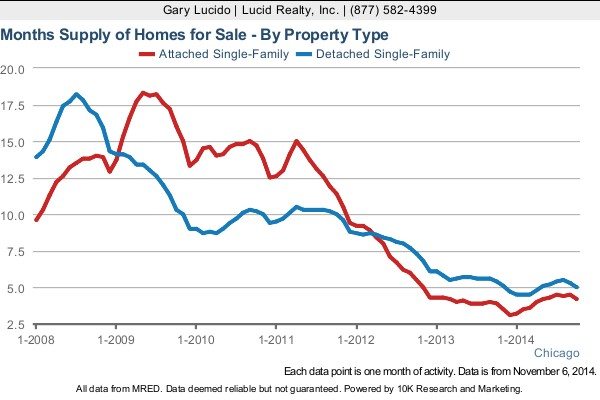
The inventory of homes for sale in Chicago remains at very low levels and this is one of the contributing factors to why sales aren’t stronger. Anyone working with a buyer today knows the frustration of trying to find something. Detached homes ran at slightly lower level of inventory than last year – 5.0 months supply vs. 5.4 months last year. Attached homes ran at a slightly higher level – 4.2 months supply vs. 3.9 months last year. Both numbers pretty much signify a seller’s market.
I should explain that inventory numbers like this are tricky. There has to be at least 10 different ways to calculate months of supply. The graphs that I am using below are convenient to generate and go back 7 years, which is really nice. Unfortunately, the contracts written numbers that are in the denominator of the calculation are a 12 month average so it totally skews the seasonality. In reality the months of supply of inventory goes way up at this time of the year because of the drop in contract activity. The graphs below do not reflect this. But they are still useful for showing long term trends.
Chicago Home Sale Market Times
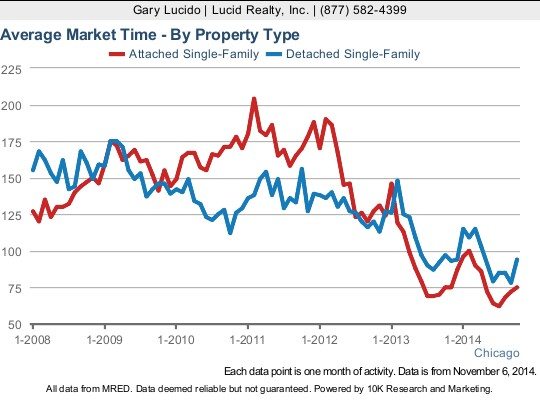
We’re seeing the typical seasonal uptick in market times with detached homes that sell selling in 94 days vs. 97 days last year. Attached homes sold in 75 days, which was basically unchanged from last year. Those are both historically low numbers.
You will also notice in the graph below that while condos took longer to sell at the bottom of the market they are now taking less time to sell than detached homes.
#realestate #chicagorealestate
If you want to keep up to date on the Chicago real estate market, get an insider’s view of the seamy underbelly of the real estate industry, or you just think I’m the next Kurt Vonnegut you can Subscribe to Getting Real by Email. Please be sure to verify your email address when you receive the verification notice.
