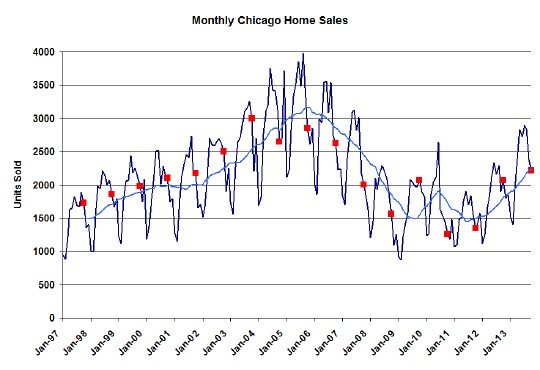
We knew the meteoric growth in Chicago home sales couldn’t last forever and we’ve been seeing signs of slowing in the contracts written so it should come as no surprise to readers of this blog that October came in at the weakest growth in 20 months. But home sales were still up 10.8% over last October at the highest level in the last 7 years, which once again places this last month as the 6th highest in the last 17 years and somewhere between the October sales of 2001 and 2002. Not bad. It’s the 28th consecutive month of year over year sales growth.
The Illinois Association of Realtors will report a growth number closer to 7.3% in about 2 weeks. In addition, their press release will mention that median prices rose by a whopping 24.6%, which simply reflects a greater mix of higher end properties being sold.
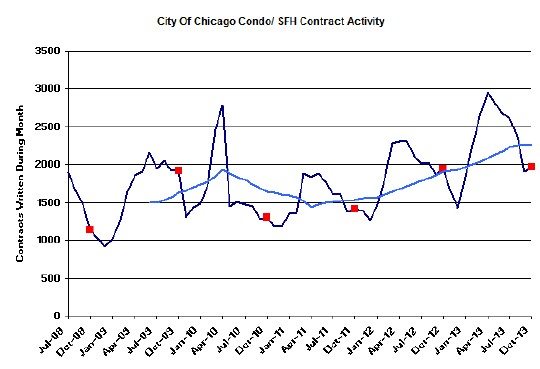
Chicago Home Contract Activity
Activity in home contracts being written is the leading indicator of home sales and this metric continues to show signs of slowing growth. For October it was basically flat to last year – up only 0.9%, after many months of 20 – 30% gains. And this is after September had similar flat performance. Look for November closings to be pretty flat to last year as a result.
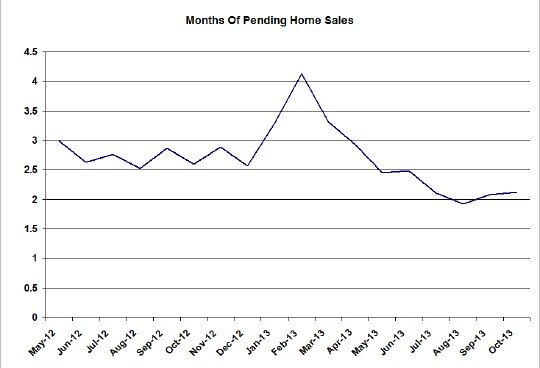
Pending Home Sales
The impact of declining contract activity is first seen in the pending home sales numbers, which are declining. At the end of October they fell once again to 4640 units. To account for seasonality and also to get a sense for how many months of closings this can support I have started to graph just that – the months of pending home sales based upon the current rate at which homes are closing in Chicago. After a few months of super high numbers at the beginning of the year, which reflected the huge sales numbers we were about to see, we are now down to about 2.1 months of pending home sales.
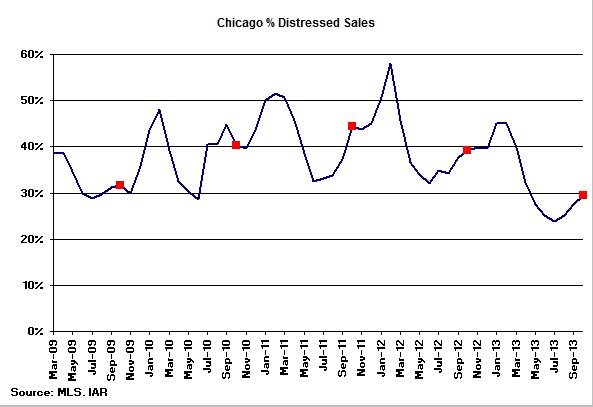
Distressed Home Sales
The percentage of home sales in Chicago that are distressed continues to run at the lowest level of the last 5 years. October came in at 29.5%, which reflects the increase that we normally see at this time of the year.
Chicago Home Inventory
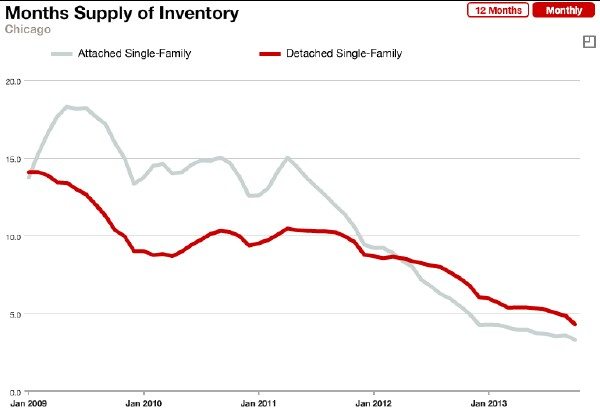
The home inventory numbers are still on the decline and at record low levels. At the end of October there was only a 4.3 month supply of single family homes and a 3.3 month supply of condos and townhomes. There just aren’t enough sellers willing and/ or able to put their homes on the market to satisfy current demand. Many sellers still have to bring too much money to closing because of their loss in home value and others, having heard that prices are on the rise, want to hold out for better pricing. The thing that the holdouts often miss though is that by holding out they are assuming that housing is going to appreciate more over the next year or two than alternative asset classes such as stocks or that the next house they buy will also be more expensive if home prices continue to rise.
I’m also beginning to believe that if more of these shadow home sellers came in off the sidelines we’d see much more activity than we are currently seeing. You might ask why I didn’t believe this before but earlier in the year we were seeing increasing contract activity. Now we’re not.
Chicago Home Sale Market Times
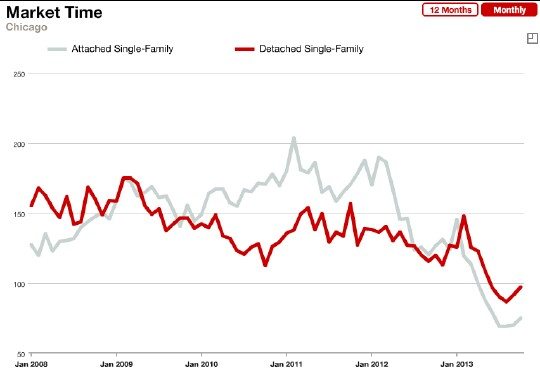
Although the time it takes to sell homes (that actually do sell) is still at record lows, we’re starting to see the seasonal uptick in this number. Single family homes that sold in October took 97 days, while condos and townhomes took 75 days. Notice that I’m emphasizing that these are for homes that do sell. Homes that just sit on the market are not included in this metric.
If you want to keep up to date on the Chicago real estate market, get an insider’s view of the seamy underbelly of the real estate industry, or you just think I’m the next Kurt Vonnegut you can Subscribe to Getting Real by Email. Please be sure to verify your email address when you receive the verification notice.
