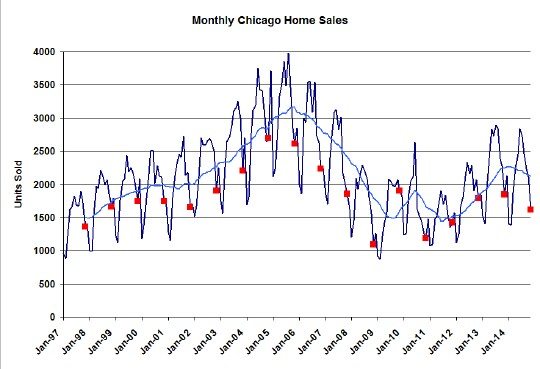
Once again, in about 2 weeks, the Illinois Association of Realtors is going to report that Chicago home sales declined in November – by about 12.3% – and once again I’m going to tell you that it’s not really that bad – depending upon your perspective. The Chicago real estate market is really doing OK when you look at non-distressed sales.
First of all the real decline in November home sales was more like 10.2% when calculated on a consistent basis. But more than 100% of the decline was attributable to a decline in distressed sales. In other words, when you just focus on non-distressed properties the Chicago real estate market actually saw a 6.7% increase in home sales.
But the headline number did drop and the graph below puts November into perspective vs. previous years with all the Novembers flagged with red squares. It looks like it was pretty much in the middle of the pack for the previous 7 years. And on the other side of the bubble you would have to go back to 1998 to find sales at this level.
Chicago Home Contract Activity
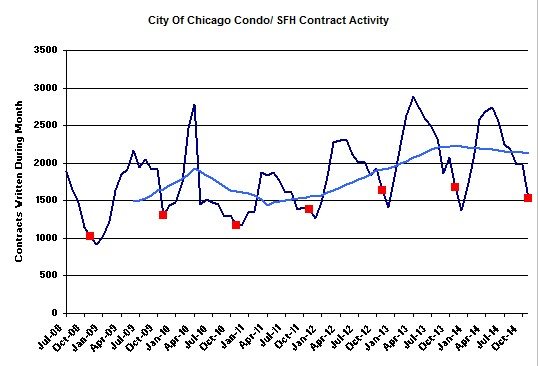
Home sale contract activity remains on the light side, which is what is driving the low sales numbers ultimately. I’m currently estimating November contract activity at 9.1% below last year’s level. You can see the long term trend in this number in the graph below, which shows the numbers trending downward for several months now.
Pending Home Sales
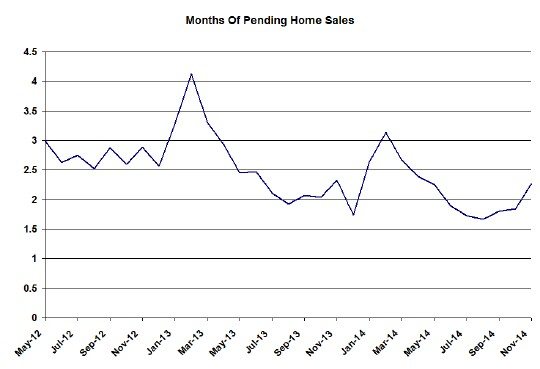
The graph below tracks pending home sales, which is essentially the cumulative difference between contracts written and sales closed, in terms of months of supply. It’s an indicator of how many months of closings can be fed from properties that are already under contract. Although the numbers have been running lower than last year November popped back up to right around where it was last year at 2.2 months supply.
Distressed Home Sales
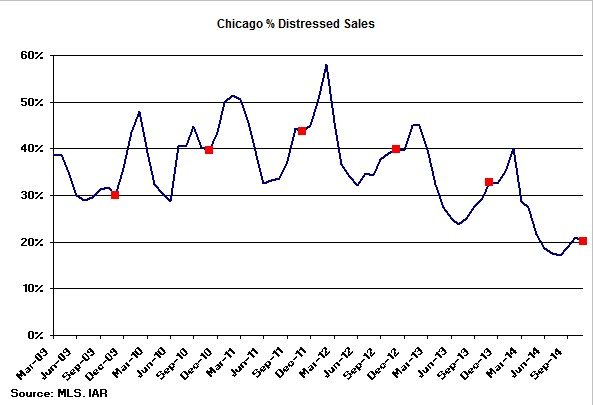
As I mentioned above the big story is the decline in distressed home sales, which is the main driver of lower home sales these days. Notice how this segment of the market is now down to only 20.2%, the lowest level by far since I’ve been tracking it. That’s down from 32.8% last year and a high for November of 43.8% in 2011.
Chicago Home Inventory
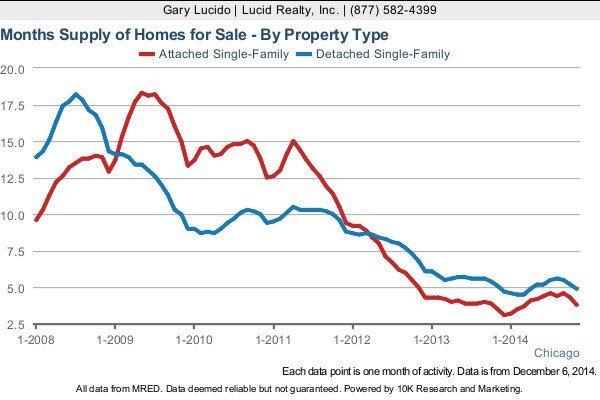
Home inventory levels, expressed as months of supply, remain at very low levels though we are seeing a bottoming of these numbers and even a slight uptick. The months of supply of detached homes in Chicago saw a decline to 4.9 months from 5.1 months last year, which is considered a low number. The supply of attached homes was even lower at 3.8 months supply but that is actually up from last year’s 3.5 month supply.
But both these numbers are low, which makes it difficult for buyers to find something decent. It’s definitely holding back the market from doing better.
Chicago Home Sale Market Times
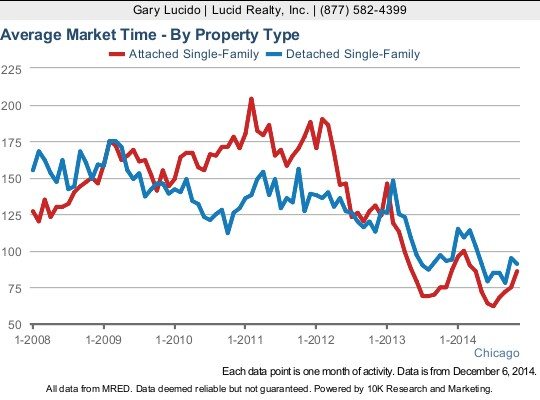
With the increase in inventory of attached homes it’s no surprise that the market times have also risen – to 86 days from 75 days. Meanwhile the market time for detached homes have fallen very slightly to 91 days from 93 days. In both cases we are still pretty much in a seller’s market and you can see just how dramatically much better the Chicago real estate market is doing than in 2011 for instance.
#realestate #chicagorealestate
If you want to keep up to date on the Chicago real estate market, get an insider’s view of the seamy underbelly of the real estate industry, or you just think I’m the next Kurt Vonnegut you can Subscribe to Getting Real by Email. Please be sure to verify your email address when you receive the verification notice.
