The 2018 report on new condo construction can be found here: Chicago’s Hottest Neighborhoods For New Condo Construction In 2018.
Once a year I like to step back and take a look at new construction in Chicago to better understand what is going on across the city because most of the time we are looking at a microcosm – this building or that neighborhood – and it’s easy to lose sight of the big picture. This year I decided to do two separate posts for new condo construction and new single family home construction, starting with condos in this post.
As you probably know from reading this blog there is a real shortage of home inventory across the city and across most segments of the market – and that’s especially true of condo inventory. So it should be no surprise that developers are taking advantage of the situation by building a lot of new condos. You’ve probably noticed all the cranes across the city, though it’s hard to tell which of those are apartment buildings – and that would be a lot. Of course, the big question is when will it be too much. Right now we haven’t reached that point yet as evidenced by the continued low inventory levels, though there is a lot more in the works and, frankly, the developers don’t put all their units on the MLS – until they close.
Let’s start by summarizing the activity by neighborhood.
Chicago New Condo Construction By Neighborhood
I’m actually doing this analysis by community area, though I’m using the term “neighborhood” because that’s the terminology many people often use. You can read this old blog post that explains the real difference between a neighborhood and a community area.
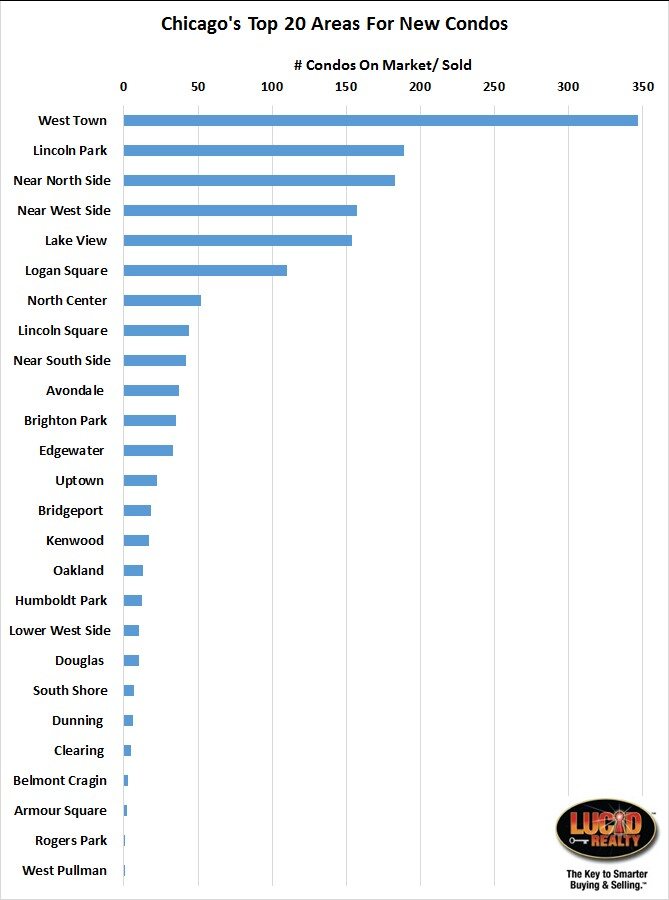
In the graph below I’ve plotted the activity in the last 12 months by community area just to give us all a high level idea of where the action is.

In West Town and Lincoln Park the new condo developments tend to be small – less than 20 units. The more notable exception would be the 89 unit, 12 story Webster Square development in Lincoln Park.
In the Near North Side more than 20 units is really the norm. The following large buildings contributed most to the activity there in the last year:
- The 51 unit, 18 story Renelle (they can’t seem to decide if it has 51 units or 45 units)
- The 45 unit, 6 story Sedgwick Locust
- The 41 unit, 8 story Ronsley
- The 38 unit, 11 story Three Sixty West
- The 26 unit, 16 story 400 West Huron
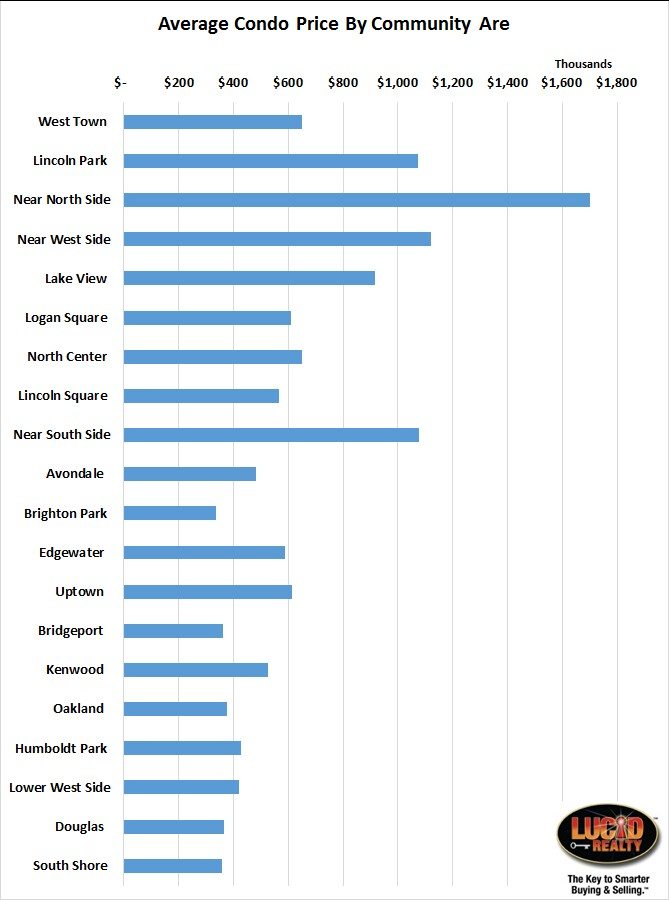
I thought it would also be instructive to look at the average price of these condos by community area in the graph below. Note that I kept it sorted by activity level and also note that these averages could be affected by differences in sizes and levels of finishes in these areas.
No surprise that the high income areas closest to downtown have the highest prices and West Town appears to be the best value in terms of price and proximity to downtown as it was last year.

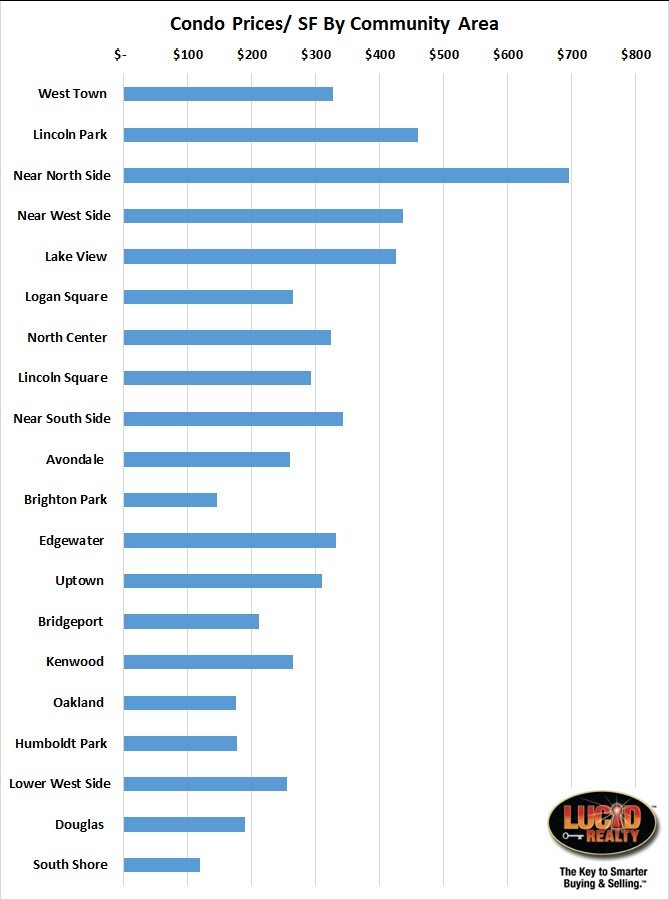
It turns out that these prices/ square foot roughly correlate with overall prices – i.e. the size of the condos in different areas must be pretty similar. West Town is still a bargain but it is a bit more expensive then Logan Square. Then again Logan Square is further from downtown.
The Near South Side appears to look better than it did on a total price basis and the underlying data does seem to suggest that the units there are larger than elsewhere. However, the data might be skewed by missing data points. And the Near North Side clearly has the highest priced square footage.
Map Of Chicago New Condo Construction
Finally, I’ve mapped all the activity below so that you can see the underlying data. The map is interactive so you can pan, zoom, and share it and you can also blow it up into a full screen map. You can click on any marker for the underlying detail and the markers are coded based on list price with a legend. The red markers are the cheapest condos and the lavender ones are the most expensive. You can more or less see the pattern of more expensive condos closer to the downtown area.
#RealEstate #ChicagoRealEstate #NewConstruction
Gary Lucido is the President of Lucid Realty, the Chicago area’s full service discount real estate brokerage. If you want to keep up to date on the Chicago real estate market, get an insider’s view of the seamy underbelly of the real estate industry, or you just think he’s the next Kurt Vonnegut you can Subscribe to Getting Real by Email using the form below. Please be sure to verify your email address when you receive the verification notice.
