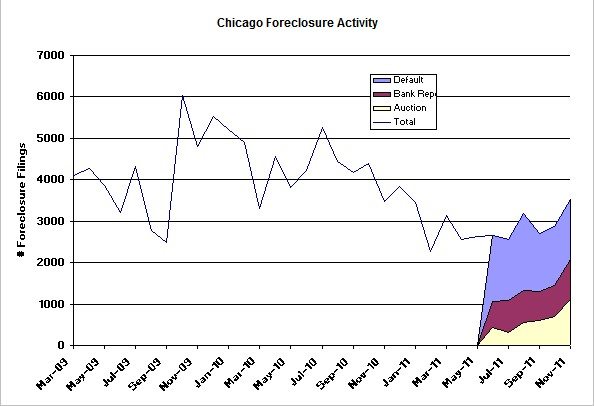
I finally figured out a more intelligent way to show and discuss the RealtyTrac foreclosure data for Chicago. The issue has been that RealtyTrac tracks 3 different stages of foreclosure activity and then adds them up: default notices, auction notices, and bank repossessions. However, a property gets counted each time it moves to a new stage of the foreclosure process so when they report the total activity they are counting properties that have already been previously counted at earlier stages – i.e. there is double and triple counting over time.
Because RealtyTrac breaks down the 3 components I’ve decided to start showing the individual components, which I think presents a more meaningful picture. For instance, in the updated graph below you can clearly see that, while overall activity is at pretty low historic levels, there has been a steady increase in the number of scheduled foreclosure auctions in Chicago over the last 6 months. That means more foreclosed properties to hit the Chicago market soon.
Unfortunately, RealtyTrac only provides the breakout of the 3 components 6 months back so I can’t go back and fill in the history. But over time this should develop into a clearer picture.
