It sure looks like June was a much better month for the Chicago real estate market. After a pretty weak May home sales actually rose by 4.3%, which is the first increase in 6 months. But keep in mind that when the Illinois Association of Realtors reports on June home sales they will report it as basically flat in Chicago – maybe up 0.2%.
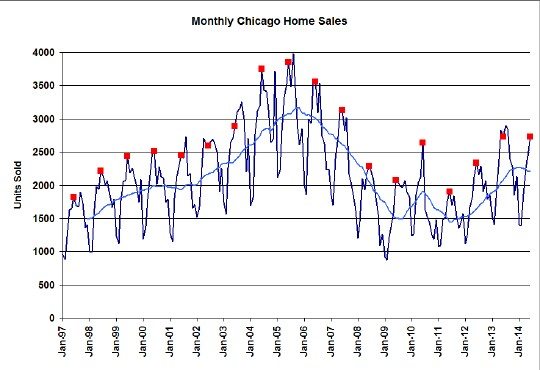
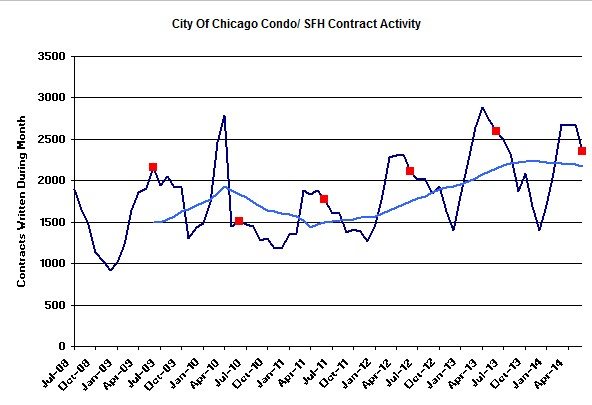
The graph below puts this June in perspective by flagging all June data points as red dots. Last month was the highest June in 7 years. Yeah, I know it doesn’t look like that in the graph below but that’s because when I say June is up 4.3% I mean when compared to this time last July – before all the data was finalized. But the graph below plots the most recent data for all time periods so it’s comparing the preliminary June numbers for last month to the final June numbers last year – and that’s the way the IAR does it. Pretty confusing, right?
Anyway, this June is also somewhere between the sales volume of June 2002 and 2003. And don’t get too excited about June being an up month. When you look at the rest of the data below it tells a rather nuanced story about how this is probably noise in the data.
Chicago Home Contract Activity
The home contract activity gives us the first clue that June wasn’t quite as hunky dory as we might want to believe. As you can see in the graph below it was down from last year. My best guess is that it will prove to be down about 9.4%, which could prove to be the biggest decline in more than 3 years. And contract activity has been down for several months now. So with contract activity down, how could sales be up? Well, that’s where the next section comes in.
Pending Home Sales
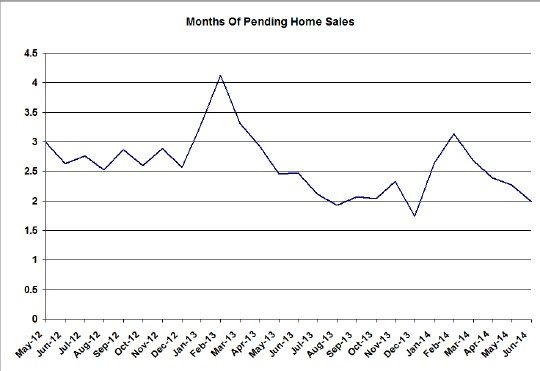
When we look at Chicago’s pending home sales data we see that it’s running at near record low levels and it declined a bit from May to just under a 2 month supply of closings. So that helped fuel the sales increase in June. But now we only have enough pending home sales to feed a couple of month’s closings.
Distressed Home Sales
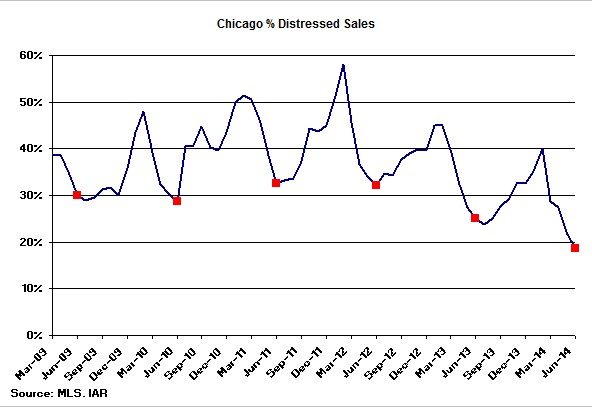
As I’ve pointed out in the past, a decline in distressed home sales is a big factor that explains the trouble we’re having keeping up with last year. The graph below illustrates just how dramatically this component of the housing market is falling. June distressed sales were at a record low percentage of only 18.7% and this decline caused about a 5.5% decline in overall sales. And the distressed sales have tended to primarily occur at the lower end of the price spectrum.
Chicago Home Inventory
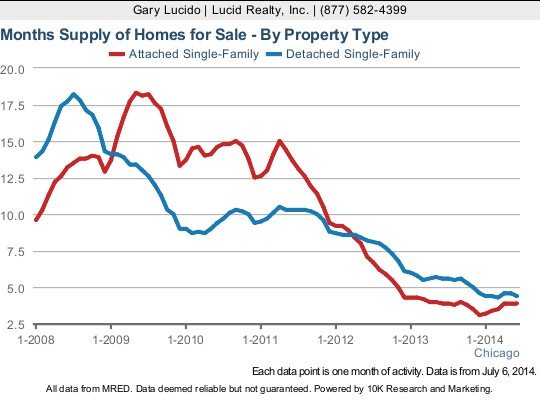
Home inventory levels in Chicago remain at record low levels. It looks like (detached) single family homes continue to hit new lows, while condos and townhomes (attached) have bottomed and actually come up a bit. Nevertheless, detached single family inventory levels are at a 4.4 month supply while condos and townhomes continue to run at even lower levels of 3.9 month supply.
Chicago Home Sale Market Times
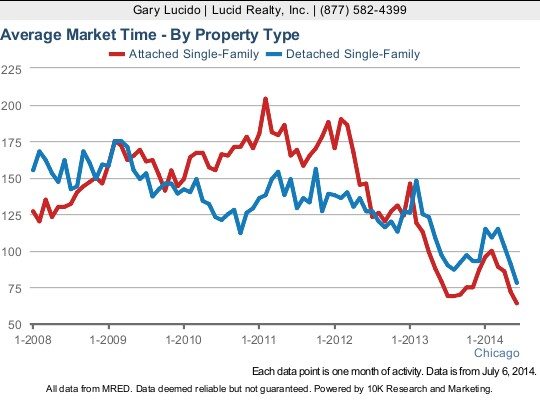
More than any other piece of data the amount of time it takes for homes to sell in Chicago is highlighting just how strong the market is. After rising dramatically for a few months they are once again plummeting and hitting new record lows. Detached single family homes only take 78 days on average while condos and townhomes are down to only 64 days.
Of course, this doesn’t mean that everything is selling fast. It’s the properties in the more desirable neighborhoods without any major flaws and priced attractively that sell quickly while others still languish indefinitely. And you never know what properties are going to meet the languishing fate. It often comes as a surprise.
#ChicagoRealEstate
If you want to keep up to date on the Chicago real estate market, get an insider’s view of the seamy underbelly of the real estate industry, or you just think I’m the next Kurt Vonnegut you can Subscribe to Getting Real by Email. Please be sure to verify your email address when you receive the verification notice.
