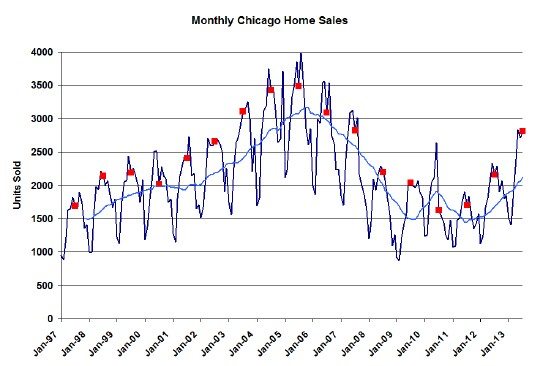
For the 25th month in a row Chicago home sales showed a remarkable increase over the previous year, with July posting a 35.3% gain over the 2012 level. This July was even a tad higher than July 2007, which was only two years into the bursting of the housing bubble. That means it’s the highest level in 7 years. Looking at the graph below you can see that this July was somewhere between the 2002 and 2003 levels and higher than 12 of the past 16 years. Not bad.

When the Illinois Association of Realtors reports in 2 weeks they will be showing only a 30.7% gain for reasons I’ve explained before. They will also report on a huge 25% increase in median prices from last year, which is a result of many different factors – an underlying improvement in home prices being only one of them. Another factor is the dramatic drop in the mix of distressed properties being sold, as explained later.
Chicago Home Contract Activity
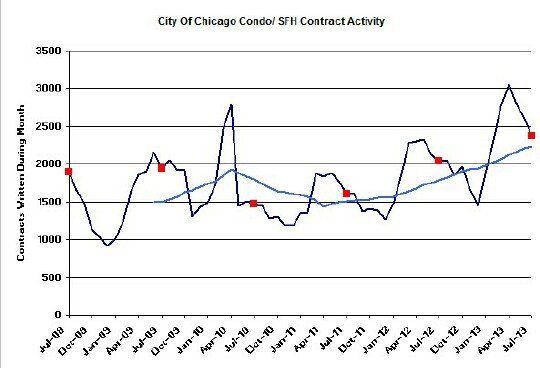
July contract activity was up a measly 16.4% from the prior year – measly because 16.4% is actually at the lower end of the range of what we’ve seen in the last couple of years. Lately the contract activity seems to be losing a little bit of steam, which could be an indication that we’re going to see closings slowing down. Consistent with this we are seeing a steady but slow drop in pending home sales. July fell to 6124, which was in fact higher than July 2012, but at a 2.2 month backlog of pending contracts that is in fact the lowest level since I began to track this 14 months ago. In other words the reason we saw such a high level of closings in July was that the backlog was drawn down.

Distressed Home Sales
Distressed home sales continue to decline as a percent of total sales. We hit a new record low (since I began tracking it) this July at only 23.9%.
Chicago Home Inventory
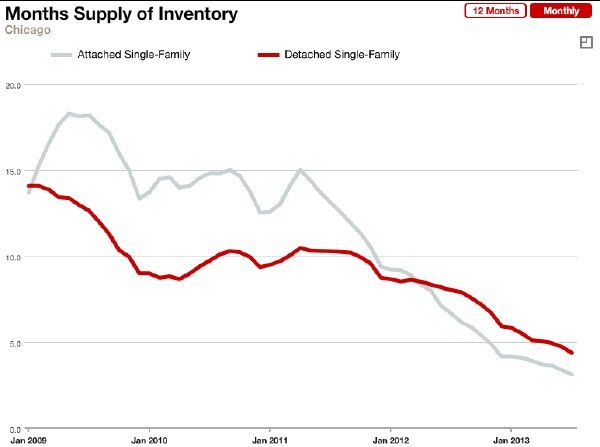
Home inventories continue to decline to new lows, with single family homes dropping to a 4.4 month supply and condos and townhomes dropping to only a 3.1 month supply. But here’s the catch. Every month I show you a steadily declining inventory level – a record low for the past 5 years. But each month the numbers I report are often the same if not higher than the numbers I reported the previous month? How is that possible?
Remember what I said earlier about a significant percentage of all contracts coming apart and not resulting in a sale? Well, as that happens the inventory for a particular point in time in the past drifts up retroactively. So the past is continually being revised upward. But at least you can pretty much trust the data more than 3 months old and when we see the tail start to rise it will be an indication that in fact inventories are increasing.
Chicago Home Sale Market Times
With inventories so low properties are selling in record time so don’t let any realtors convince you that they are doing a good job just because their listings are selling fast. It’s not just irrelevant now, but it’s always irrelevant since anyone can sell a property fast if it’s priced low enough. Is that what you want? But I digress.
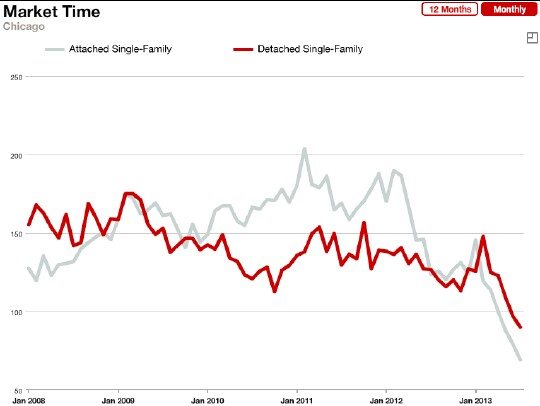
As you can see in the graph below the market times have really plummeted. Single family home market times have pretty steadily declined from a high of 175 days to the current record low level of the past 6 years of 90 days, or almost half of that peak. But the change in market times for condos and townhomes has been even more dramatic. Those market times continued to rise until early 2011, eventually peaking at 204 days, but now they have plummeted to only 69 days!
Please note that these market times represent how long it takes to sell just those homes that do sell. In other words, homes that just sit on the market forever are not included – until they eventually sell. However, those properties are included in other versions of market times that I report elsewhere.
If you want to keep up to date on the Chicago real estate market, get an insider’s view of the seamy underbelly of the real estate industry, or you just think I’m the next Kurt Vonnegut you can Subscribe to Getting Real by Email.


