19 months and counting of monthly growth in Chicago home sales – 11 months of double digit increases. January home sales grew over last year by a whopping 35.5%, which is the second highest growth rate since April 2010. And all this at a time when inventories are at record low levels, leaving buyers fighting over scraps. OK. I admit to being a little dramatic here.
Keep in mind that in about 2 weeks the Illinois Association of Realtors will release their official numbers but looking at the same data that I am they will come up with about 31.9% growth. I’ve explained this before. You can see my December Chicago real estate market update if you really want to know how that happens.
January Chicago Home Sales
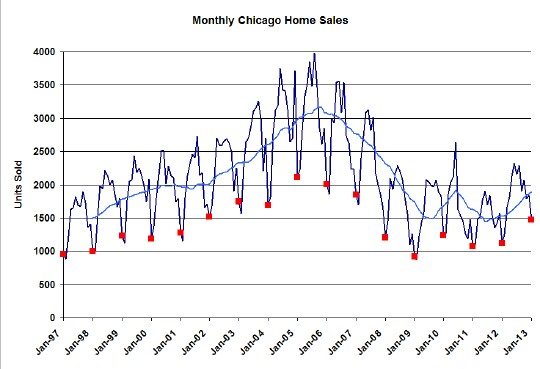
The graph below shows monthly sales history going back to January 1997 with all the January’s flagged in red and a moving average. Notice how last month’s sales were the highest January by a healthy margin going back 6 years. January home sales were roughly equivalent to the level hit in January 2002. At least we’re out of the levels of last century. In addition, notice how the moving average is now back to where it was right in the middle of that idiotic government giveaway program.

Chicago Home Contract Activity
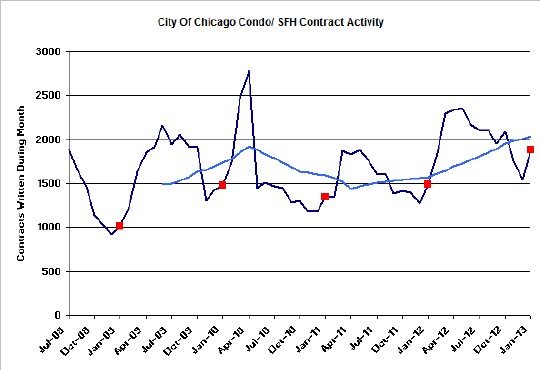
I finally had to restructure my home contract activity chart so that it was easier to interpret. It now becomes clear how contract activity has been steadily trending upward and January set another record with home contract activity up 26.2% over the previous year. That’s 21 straight months of increases in contract activity.
Given the delay between when a contract is written and when the deal closes there are now 4,994 sales pending. At the current rate of deal closings that’s enough to feed another 3.4 months of closings. In other words, we’re going to be seeing continued growth of home sales for a while.
Chicago Home Inventory
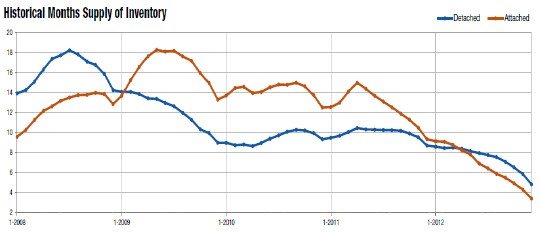
It’s the same old story with home inventory – record lows, not only for this time of the year but for any time of the year. The graph below from the Chicago Association of Realtors shows the months of supply of inventory through December. And it just keeps going lower. It’s a great time to be selling.
Distressed Property Sales
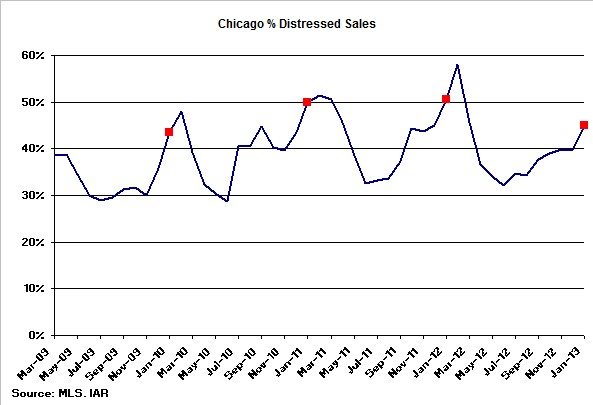
I had to restructure my distressed property sales graph as well. The graph below shows the percentage of home sales by month for short sales and foreclosures with all the January’s flagged in red. As you can see last month was within the range of recent history. 45% were distressed. The percentage sales of distressed properties always rises at this time of the year as inventory declines while the most desperate sellers have no choice but to be on the market.


