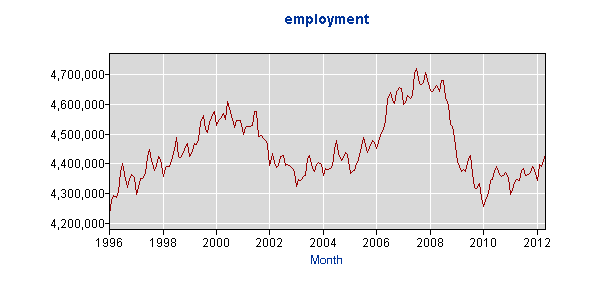
When I finally got around to updating my Chicago area real estate statistics page with the most recent labor data the other day I was struck by the fact that there has been a general upward drift in the employment numbers for the Chicago metro area over the last couple of years. It’s easy to miss when you focus on the month to month fluctuations but in the graph below you can see how much the employment picture has changed since the low point of January 2010. We’ve added 173,000 jobs since then, even though we are still 290,000 jobs below the peak of July 2007, shortly after the housing bubble burst.

You’ll notice that I’m focusing on employment instead of unemployment. The reason for that is that the unemployment numbers are subject to all sorts of distortions based upon the assumed size of the labor force and who is looking for work and when. The employment numbers don’t suffer from those problems. But in case you are interested the unemployment rate in the Chicago area has declined recently to 8.5% – still high but much better than the absolute high of 11.9%.
In case it’s not obvious the reason that anyone interested in Chicago’s real estate market should focus on employment is because only employed people buy houses and more jobs mean more people in the area looking for places to live. If this employment trend continues we will see more buyers out looking for homes.