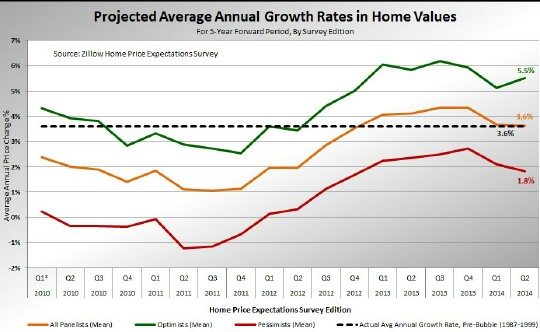
Late last week Zillow released their latest Home Price Expectations Survey, which is conducted by Pulsenomics. The survey obtains input from over 100 real estate “experts”, including economists. The orange line in the graph below looks at their mean outlook over time for the average annual growth rate for the survey’s time horizon of 5 years. As you can see they were slightly optimistic when prices were falling and now that prices are rising again they have become a bit more optimistic.
Their outlook is basically unchanged from last quarter – 3.6% per year growth, which is the average growth over the pre-bubble period. These guys (no specific gender implied) just don’t deviate too much from that long term trend. Also, note that that growth rate for the nation is also very close to Chicago’s growth rate over the same period – 3.7%.
As with last quarter’s outlook, the experts are most optimistic about 2014, forecasting 4.4% growth, decreasing their outlook each year until you get to 2017 and 2018 with 3.2% growth.
Personally I did not find Zillow’s Chief Economist, Dr. Stan Humphries, insights on the market to be particularly insightful but then again they have to quote him in the release:
Inventory is being held back by stubbornly high negative equity, which means supply can’t keep up with demand, in addition to low rates of new home construction. Additionally, many more would-be buyers are stymied by tight credit or an inability to save for a down payment. And finally, despite a generally improving economy, incomes have not risen at the same level as home values and rents, leading people to spend an ever-larger share of their pay on housing.
In other words supply and demand are both down, although I would argue that the inventory shortage is a much bigger factor.
As is fashionable these days they also pontificated on the affordability “issue”, which I don’t understand. Prices are 21% below the bubble peak and interest rates are lower. Can we really have an affordability issue today when we weren’t aware that we had one during the bubble? What’s more likely is that people are reacting to the decline from the record high home ownership rates during the bubble when anyone could buy a house without really being qualified for it. I don’t see us going back to those days.
Outlook For Chicago Area Home Prices
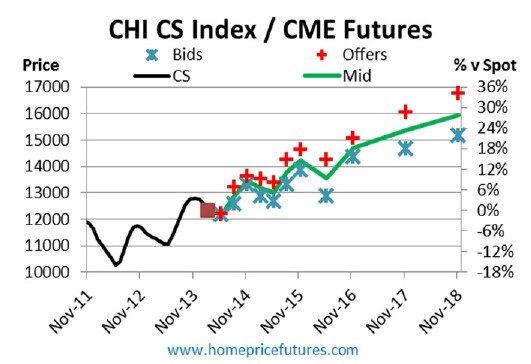
When it comes to the outlook for Chicago home prices I like to look to the Case Shiller home price futures market to see what outlook people are putting their money on. The graph below comes from John Dolan’s April 2014 Case Shiller Futures Review. The November 2018 contract is actually valued slightly higher than it was for the January review so the market has become more optimistic since then – the market now has the index 2.3% higher in that time frame. The net result is that the outlook is for there to be a cumulative increase of 24.6% over the 5 year period from September 2013 to September 2018, which works out to 4.5% per year on average.
If you want to keep up to date on the Chicago real estate market, get an insider’s view of the seamy underbelly of the real estate industry, or you just think I’m the next Kurt Vonnegut you can Subscribe to Getting Real by Email. Please be sure to verify your email address when you receive the verification notice.

