According to several measures that I track the Chicago real estate market continued to show signs of real strength in May.
May Home Sales For Chicago
These are the numbers that the Illinois Association of Realtors reports but if you read this blog you get these numbers 2 weeks earlier than everyone else. In May Chicago home sales were up 19.2% over last year, which continues a very positive trend now for several months. Why am I saying “several months” instead of giving you an absolute number? Because the government screwed up the market with that damn tax credit and it’s hard to know when that effect finally disappeared. Suffice it to say that things have been in a decidedly positive trend for at least 5 or 6 months now.
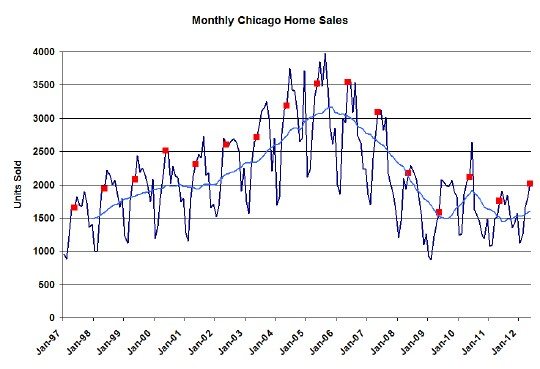
With this month I’m introducing a new chart that shows the long term trend in Chicago home sales based upon data I pieced together from an anonymous but highly credible contributor to Cribchatter and my own collection of data from various MLS based sources. The graph below goes back to January 1997 and has all the May numbers flagged for comparison. In addition, the light blue line shows the 12 month moving average, which smooths out the seasonal effects.
One caveat about this chart…the data for the last 24 months is updated each month of the 7th. However, by the 7th not quite all previous month’s sales are recorded. In fact, history continues to get updated indefinitely. So for the most recent months the sales are slightly understated and then get corrected as time progresses.

As you can see in this graph May 2012 had the highest closings in 4 years, with the exception of May 2010 when the government paid people to buy homes. However, we’re at a level that is somewhere between where we were in 1998 and 1999 – pre-bubble. You can also see that the moving average is showing a clear upward trend for the last few months.
Home Contract Activity
A great indicator of where Chicago home sales are heading is the contract activity, and as you can see in the graph below, the number of contracts written have been surging way ahead of the last 3 years. May contract activity was up a bit more than 19% over last year, a smaller percentage increase than the last 3 months that have been as much as 40% higher than 2011.
One of the great mysteries of the last several months is how contract activity can be so much stronger than closings, even after adjusting for expected contract failures (adjustment included in the graph above). For this reason I’m going to start reporting on the pending home sales for Chicago – “pending” as in the generally accepted definition of contracts not yet closed. As of today there are 6,355 pending home sales from contracts written prior to the end of May. You should notice that that is roughly a 3 month supply of closings. And some of those are pretty darn old.
Home Inventories
As I’ve said in previous posts sellers are reluctant to put their homes on the market with prices as low as they are, resulting in a less good inventory than in previous years. Combine this with the fact that sales activity is up over last year and the months of supply of homes is at a record low. This graph from the Chicago Association of Realtors shows the months of supply of home inventory for both detached (blue) and attached homes (brown) going back to 2008. They don’t calculate months of supply the way I would but it still gives you a sense as to just how low inventories are.
OK. You want to know how they calculate months of supply. They are taking the number of homes available for sale at the end of a month and dividing it by the average monthly pending home sales for the previous 12 months.
Distressed Property Sales
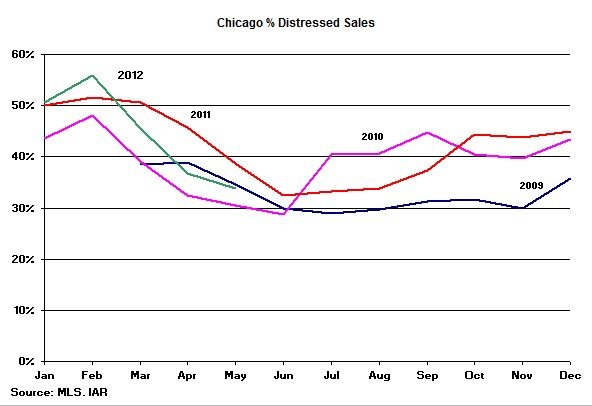
In the graph below I show the percentage of home sales that were distressed – either short sales or foreclosures. In May 34% of home sales were distressed. This is down considerably from 2011 because of the higher sales volume of non-distressed properties although it is higher than in 2010. 2010 was depressed because of the higher sales volume of non-distressed homes stimulated by the homebuyer tax credit.
We maintain a collection of these and other statistics on our Chicago real estate market statistics page.


