There is an updated version of this post with data through June 2020 here: Chicago Murder Map And Neighborhood Totals – 2020 Update
Every July, at the peak of Chicago’s crime season, I update my statistical summary of Chicago’s murders and other physically threatening crime. It’s my response to a common question in real estate that we can’t easily answer: which are Chicago’s safest and most dangerous neighborhoods?
We can’t easily answer the question because 1) safe and dangerous are subjective terms 2) crime happens everywhere in Chicago and if we told you that a neighborhood was safe you would be pretty pissed the next time a crime was committed there and 3) the level of crime in a neighborhood is constantly changing. Therefore, the best thing for me to do, as usual, is provide good data to help our clients decide for themselves.
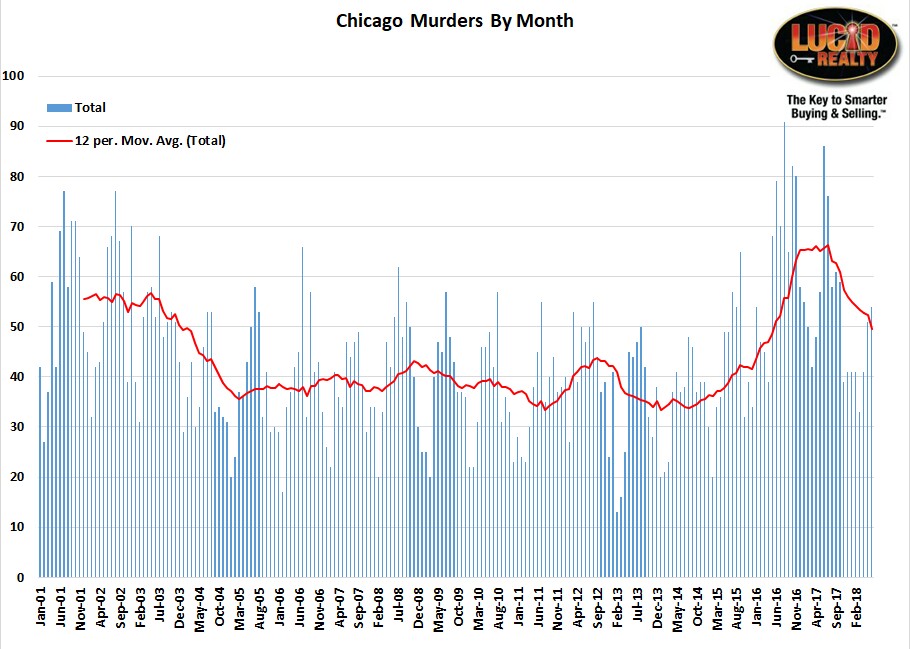
So let’s start with murders. I like to provide the historic perspective on the murder rate with data that I have back to January 2001. I’ve plotted it below along with a 12 month moving average to take out seasonality and make the current trend more clear. You can click on it for a larger view.
As you can see the situation got really bad in 2016 and 2017, hitting new highs. This year it’s getting better but it still is much higher than it was during the decade ending in 2015. For the 12 months ending in June 595 people were killed, compared to 784 last year at this time.

Chicago Murder Rate By Neighborhood
My first pass at providing a crude indicator of “safe” or “dangerous” neighborhoods is to look at the number of murders per 100,000 residents in each of Chicago’s 77 officially defined community areas and then rank them from low to high. I think it’s important to point out that I’m referring to community areas as neighborhoods in this case, though normally I disapprove of doing this. I’m only doing it because people are looking for “neighborhood” crimes statistics and this is the closest thing to it. So, for example, you’ll find Lake View on the list but not Wrigleyville.
The results are displayed in the graph below, which is too tiny to read until you click on it for a more readable version. Some of the more interesting observations from this analysis:
- There are actually more community areas this year that had little to no murders.
- Since I live in West Town I always pay attention to those statistics and its murder rate is slightly worse than last year.
- The Near West Side, which includes the West Loop but also goes considerably west of there, did improve somewhat from last year.
- Uptown often gets a bad rap but in reality its murder rate isn’t that awful – by Chicago standards.
- McKinley Park got much worse this year, though a small portion of that resulted from me using lower population numbers there.
- Englewood and East Garfield Park actually improved considerably this year, allowing West Garfield Park to become the undisputed leader in this morbid game.
Map Of Chicago Murders
Since the community areas are pretty large and since people usually want to understand crime rates in much smaller and very specific areas I plot them all out on an interactive map shown below. You can pan and zoom, you can open a full page version of the map, you can share it, and you can click on each of the balloons to get more information on the homicide. Playing with the map like this allows you to evaluate the relative frequency of incidents between different areas.
There are some clear patterns that emerge:
- As you probably already know the frequency of murders is highest on the west side, west of California and south of North Avenue, and on the south side, south of Pershing.
- It seems to me that murders moved farther west than last year, with fewer incidents occurring between Western and California.
- It looks like the frequency of murders is higher on the West side than the South side.
- The murders tend to be clustered in several small areas.
- Busy streets tend to be popular places for killing someone.
Stay tuned for more information on Chicago’s violent crime in a week or two. At that time I’ll be looking at safe and dangerous neighborhoods in terms of aggravated assault and battery.
#ChicagoCrime #ChicagoMurder #ChicagoHomicide
Gary Lucido is the President of Lucid Realty, the Chicago area’s full service discount real estate brokerage. If you want to keep up to date on the Chicago real estate market, get an insider’s view of the seamy underbelly of the real estate industry, or you just think he’s the next Kurt Vonnegut you can Subscribe to Getting Real by Email using the form below. Please be sure to verify your email address when you receive the verification notice.