I finally got around to this long overdue post about Chicago’s hottest neighborhoods and then quickly realized what was obvious: the neighborhoods that look the hottest depend upon whether or not you are looking at condos or single family homes. So I decided to start by looking at Chicago’s condo market, which is actually easier to analyze simply because there are more condo transactions in most neighborhoods than single family home transactions – i.e. you can trust more of the data.
I need to start by explaining a few things. First, I should clarify that even though the word “neighborhood” is in the title of this post I’m really focusing on the 77 community areas because it would be almost impossible to analyze the data down to the neighborhood level since they are not pre-defined in the MLS. It’s just that everyone in Chicago uses the word neighborhood to refer to these community areas so I decided to follow that convention even though I think it’s wrong – see my post on Defining Chicago’s Neighborhoods.
So then the question is how do you define “hot”? A lot of media outlets and real estate information providers will often look at some measure of interest level – e.g. page views of listings in a given area. I tried looking at Google Trends. But the problem with that approach is that interest is not as meaningful as action and I don’t know if more people are looking for homes in River North or restaurants and if they are looking at more homes in Humboldt Park is that because they want to buy them or because there are more available at lower prices?
So ultimately I decided to focus on the change in average sales prices over time because that will show you the extent to which people are willing to invest more money in these neighborhoods than in the past (I’ll explain in another post why this does NOT necessarily mean prices are rising in these neighborhoods). I looked at the average prices paid in the first 2 months of 2012, 2013, and 2014 for each of the 77 community areas and threw out the ones with too few sales to be meaningful. Then I identified 3 community areas that showed huge average sales price percentage increases over that time period and then pulled their long term graphs from the MLS. I won’t show you my starting data because it’s a mess and hard to make any sense out of but I will show you the graphs below.
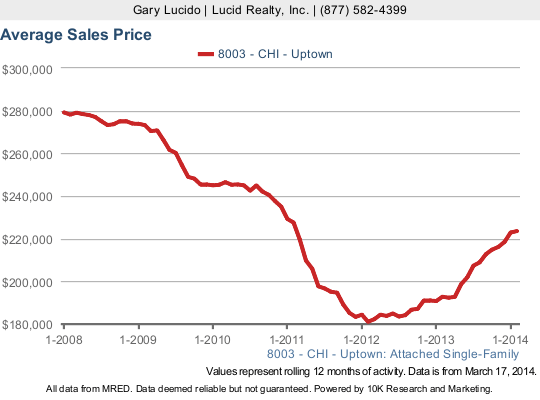
Uptown Average Condo Prices Up 24% In Last 2 Years
There are probably a couple of factors contributing to this increase in Uptown. First, there is the overall increase in home prices, which could easily explain more than half this gain. The other factor is the reduction in distressed sales over this 2 year period – from 42% of the sales down to 24%. The bottom line is that the Uptown market is a lot healthier than it was 2 years ago. But as you can see in the graph below this is largely a recovery effort that is nowhere near reaching the highs of even 6 years ago.
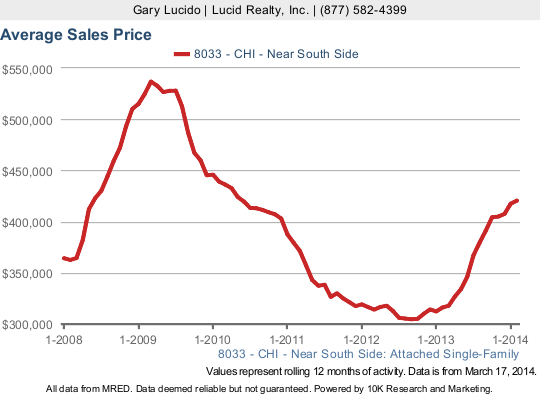
Near South Side Up 38% In Last 17 Months
Well, I’ll tell you one thing that has really changed in the Near South Side over this time period – the inventory situation, which has permitted better price realization for sellers. In particular Related Midwest took over hundreds of languishing developer units (e.g. Museum Park), repackaged them, and repriced them. And, as in Uptown, there has been a dramatic reduction in distressed sales – from 45% to 16% over this time period.
Interestingly, the average sales prices surged in early 2009 even as the market was deteriorating and is now trying to retrace those heady days.
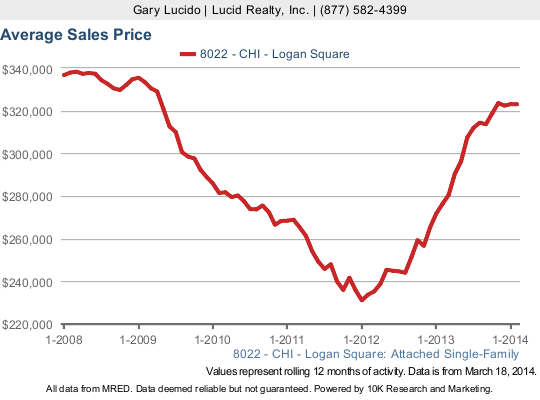
Logan Square Up 40% In Last 2 Years
Wow! It looks like Logan Square has almost fully recovered from 6 years ago. Again, a reduction in distressed sales from 36% of the total to 17% of the total seems to be a big factor but the other driver appears to be a greater mix of newer housing stock. Not sure what to make of that.

If you want to keep up to date on the Chicago real estate market, get an insider’s view of the seamy underbelly of the real estate industry, or you just think I’m the next Kurt Vonnegut you can Subscribe to Getting Real by Email. Please be sure to verify your email address when you receive the verification notice.

