When the Illinois Association of Realtors announces June home sales for Chicago in 1 1/2 weeks they will appropriately trumpet June’s 22.4% increase over last year – the 4th month in a row of double digit year over year sales increases. What they won’t tell you about is how June contract activity was pretty disappointing and that does not bode well for continued healthy sales increases.
June Home Sales For Chicago
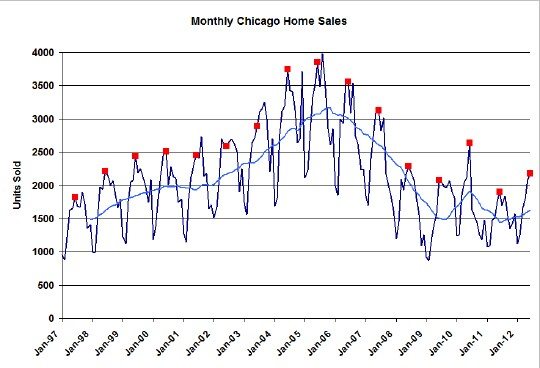
The graph below goes back to January 1997 and has all the June home sales numbers flagged in red for comparison. In addition, the light blue line shows the 12 month moving average, which smooths out the seasonal effects. You can see that last month was higher than June of last year and 2009 and that the moving average has been trending upward recently. By contrast June 2010 was still higher but that was an aberration driven by the government’s homebuyer tax credit nonsense. This June falls somewhere between the activity seen in 1997 and 1998, before things got crazy.
Home Contract Activity
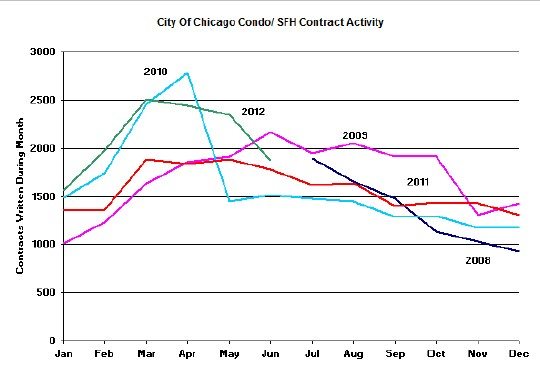
If you want to know which direction home sales are headed in Chicago look no further than contract activity, which theoretically should lead home sale activity by a month or two – actually it’s more complicated than that. Looking at the home contract activity graph below you can see that it peaked early this year – in March – and has been on the decline since then. June was up only 5.3% over last year and this is the smallest year over year increase in 14 months.
The more complicated part of the story I alluded to above is pending home sales, which accounts for the difference between contracts written and deals closed. For June pending home sales in Chicago were down slightly to 6139 from 6355 in May. However, that’s still enough to fuel almost 3 months worth of closings.
Home Inventories
The crux of this story may be in the home inventory levels – a topic which I’ll devote an entire blog post to shortly. As you can see in the graph below the months of supply of homes for sale is at its lowest level in 5 years. As I’ve mentioned on numerous occasions sellers just don’t want to sell at current prices and if I showed you the graph (at some point even I have to limit the number of graphs in one blog post) you would see that new listing activity for condos is way down from historic levels while the new listing activity for single family homes is at a low level but about the same as last year.
So here’s the question: is contract activity down because of lack of interest on the part of buyers or lack of interest on the part of sellers? If it’s the latter then we could see upward pressure on prices, which is what everyone is really interested in.
Distressed Property Sales
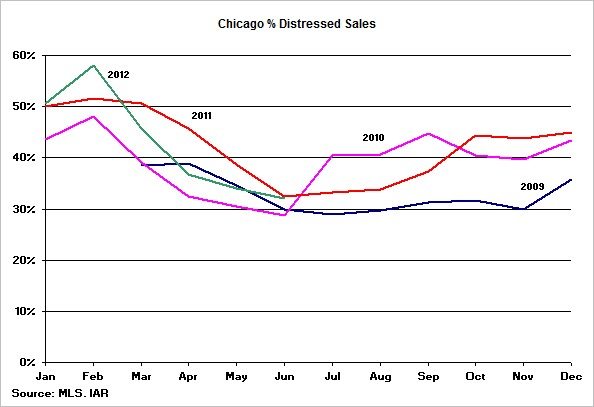
Distressed property sales accounted for 32% of Chicago’s total home sales in June, which is essentially the same as last year and pretty typical for this time of the year as you can see below.
We maintain a collection of these and other statistics on our Chicago real estate market statistics page.


