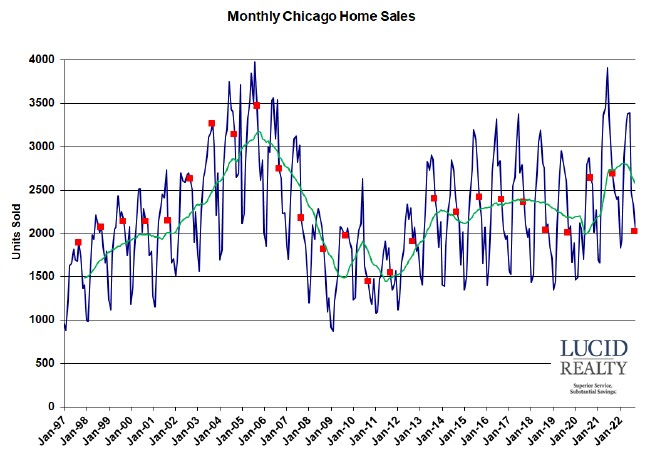
Well, at least the Chicago real estate market did not have the worst September homes sales in 10 years. It was merely the third worst and very close to the other 2 worst September home sales numbers. It was also 22.3% below last September, which was part of the post-pandemic surge in home sales. The graph below puts it all in perspective going back to 1997. As you can see this puts us back in line with 2018 and 2019 – those other two worst years. Oh…and both detached and attached homes seem to have equally contributed to the decline.
The Illinois Association of Realtors will come out with their version of this story in two weeks. Look for them to claim a 24.4% decline in home sales. They do math a little differently than I do.
Chicago Home Contract Activity
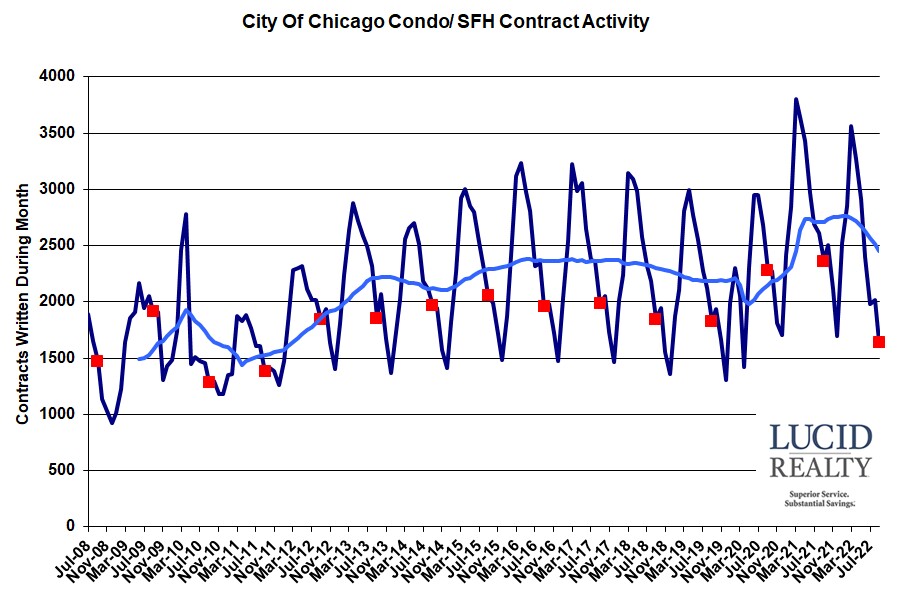
However, Chicago home contract activity was the lowest in 11 years – down by 30.7% from last September, which is the largest percentage decline in more than 2 years and the 6th month in a row with a double digit decline. Contracts written on attached homes appears to have suffered a bit more than for detached homes. The bottom line is that this does not portend well for future home sales.
Pending Chicago Home Sales
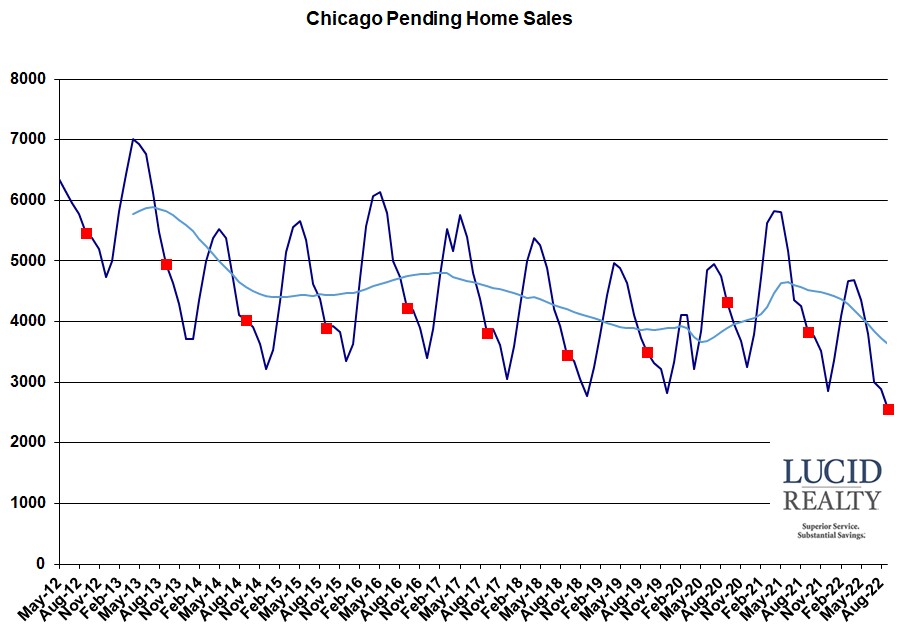
More depressing news. Check out the graph below and behold the lowest pending home sales since I’ve been tracking the data – by a lot. Pending home sales are down almost 1300 units from last year. What that means is that the pipeline of contracts waiting to close is looking pretty bleak. This is just further reason to believe that home sales are going to suck next month.
Distressed Chicago Home Sales
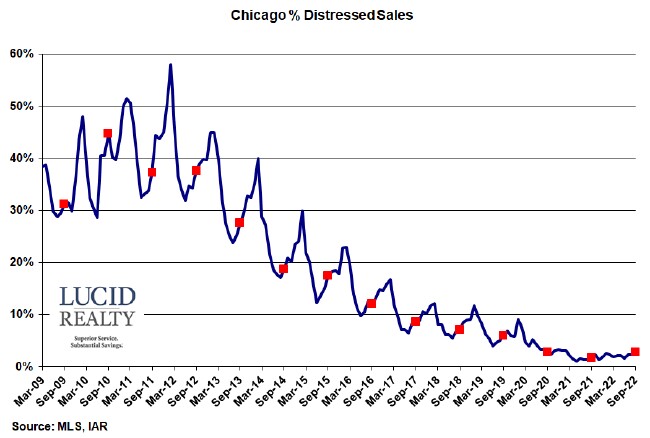
The percentage of Chicago home sales that are distressed is still at the lower end of the historic range. As you can see in the graph below this percentage has been trending down for years. It really bottomed out when the foreclosure moratorium was in effect. Now that that has been lifted the percentage is drifting up again but not very rapidly. This market downturn is truly different than the last one – rate driven rather than bubble and loose lending standard driven – so we don’t really expect distressed sales to surge that high from here.
Chicago Home Inventory
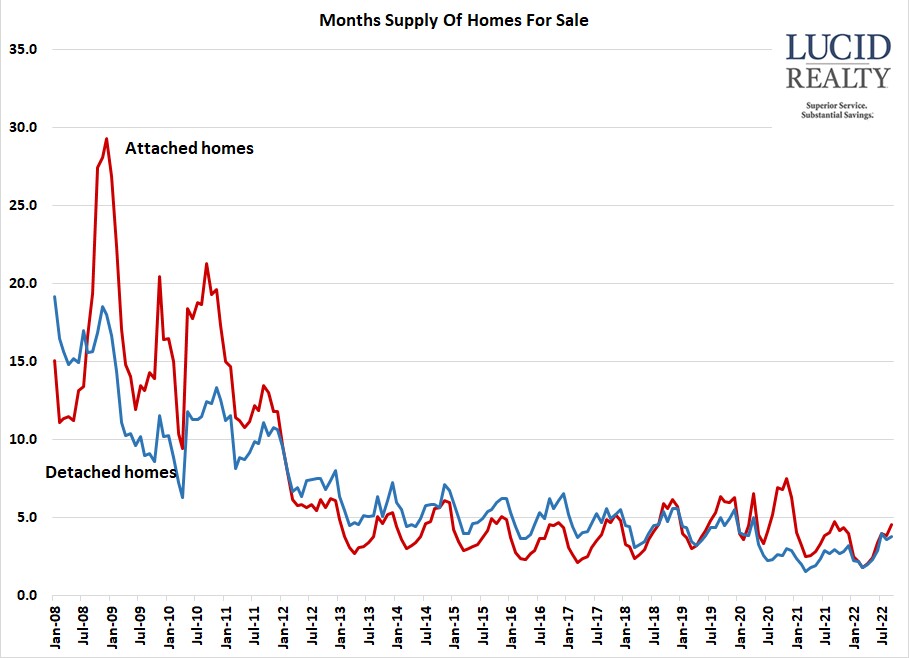
I’m still calculating my own months of supply so that I know what goes into the calculation. I’m looking at the monthly number of homes available for sale divided by the number of contracts written in the same month. On this basis the inventory of homes for sale in Chicago is still at the lower end of the range. In fact, the inventory of attached homes is near an all time record low. It fell to a 4.6 month supply from a 4.7 month supply last year. However, the inventory of detached homes actually rose to a 3.8 month supply from last year’s 3.0 month supply. But that’s still pretty low by historic standards – lower than all years prior to 2020.
Chicago Home Sale Market Times
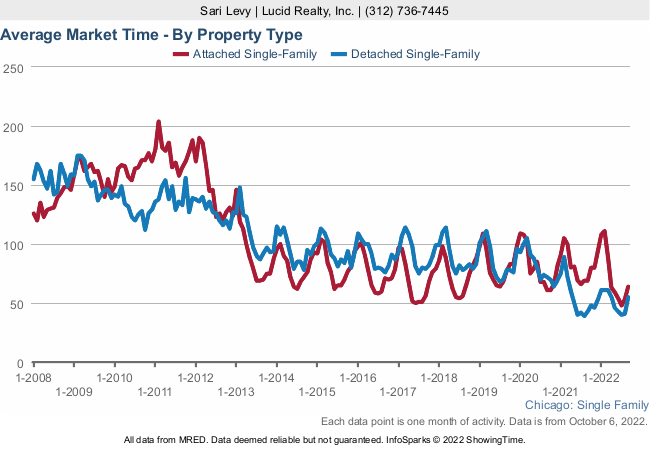
What buyers and sellers really care about are prices and market times. I owe you an update on prices but…as for market times…they are still respectable. The average attached home that closed in September went under contract in 64 days, which is down from 69 days last year. The average detached home sold in only 55 days but that’s up from last year’s record low of only 43 days. And half of all homes sold in 31 days or less.
In case you are wondering why I haven’t posted much lately…I just moved to North Carolina and have been preoccupied for the last few weeks. I now have new appreciation for what our clients go through. It’s not as much fun as it appears to be. I have some new insights from the experience and hope to share those at some point.
