Hmmm. After looking at the February data I’m thinking that maybe the Chicago real estate market really is doing something more than simply making up for the lost activity during the initial lockdown when the pandemic first hit. Maybe we really have entered a bull real estate market, though the bull may be losing a little steam.
Let me start with the basics first. February closings were up 10.6% over last February. Keep in mind that the impact of the pandemic did not hit closings until April of last year so it’s not like February was an easy comp. So 10.6% is a pretty good showing, though I need to point out that it’s the lowest year over year growth in 6 months. Hence the losing steam comment above. On the other hand it’s still another 14 year record high in closings which you can clearly see in the graph below. That graph shows a long history of monthly closings along with all February data points flagged red and a 12 month moving average.
Note that 10.6% growth number will become 8.7% when the Illinois Association of Realtors reports it in about 2 weeks based on their flawed calculation. Also, for the record, all the growth came in condo sales. Single family homes might have done better if there had been enough inventory available. More on that later.
The reason I think there may be some kind of long term bull market at play here is that we’ve just now made up for the entire shortfall that occurred last year. Closings in the 12 months ending in February were essentially the same (actually a handful higher) as the 12 months ending last year. Yet there are signs of continued strength.

Chicago Home Contract Activity
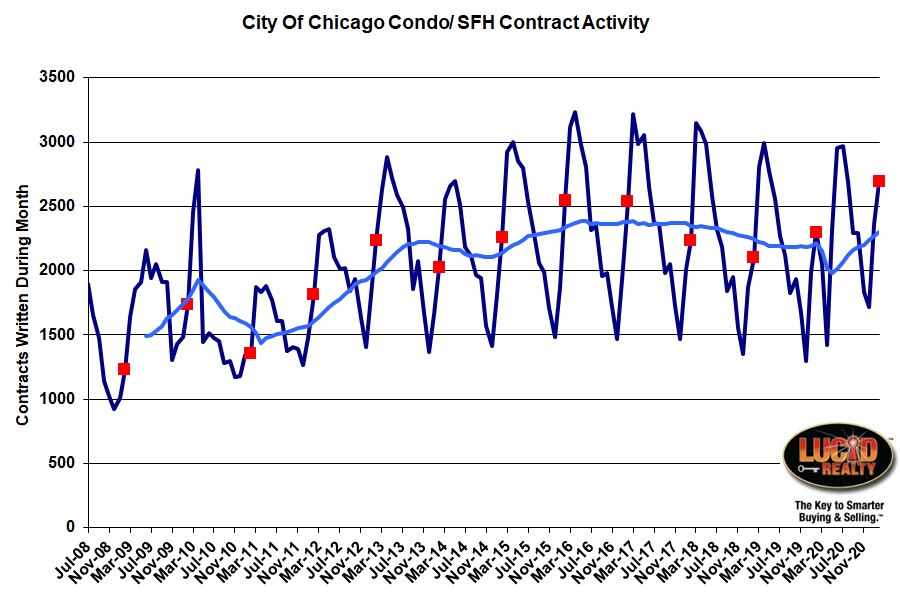
It’s the contract activity that tells me that there are signs of continued strength in the real estate market because contracts precede closings by a month or two and February contracts were up by 16.8% over the previous year. This is the 9th consecutive month in which we’ve had a year over year increase and this is the record highest level since I’ve been tracking the data – 13 years.
Pending Home Sales
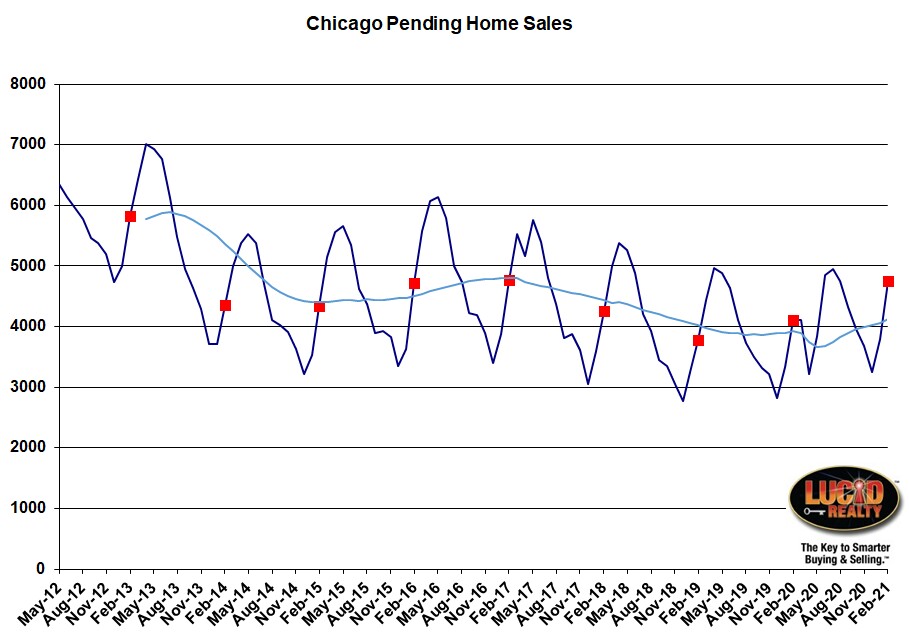
Since contracts don’t immediately close they temporarily go to the pending home sales bucket which I have graphed below. It had been on the decline for several years but now it’s filling back up as homes go under contract faster than they close. But eventually these pending contracts do close and they end up boosting closings.
As you can tell pending home sales hit a 4 year high. It was also up 627 units from last year, which corresponds to a little less than 1/3 of what usually closes in March so it can make a significant contribution to March closings.
Distressed Home Sales
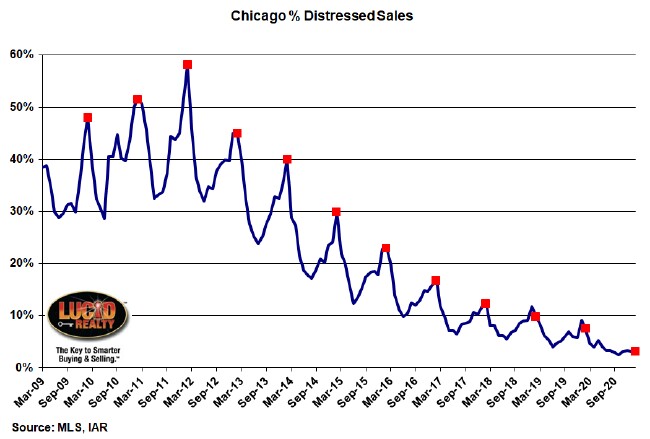
With the foreclosure moratorium continuing to be extended it’s no surprise that the percentage of distressed sales continues to fall. Normally, February is pretty high – last year it was 7.6%. However, this year it was only 3.1%. It appears to be flatlining in the graph below.
Chicago Home Inventory
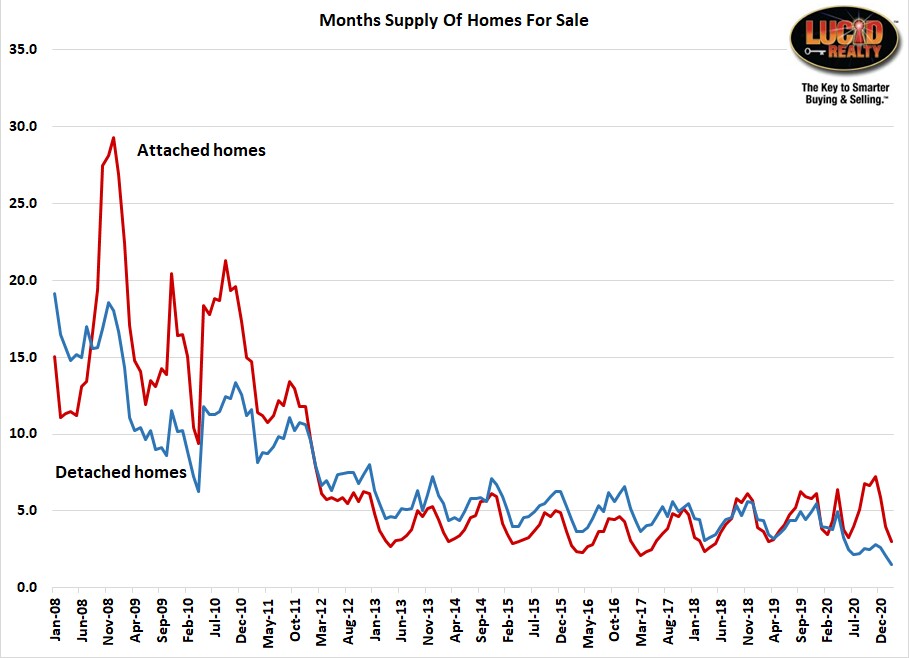
Because of all the peculiarities in the data I’m still producing my own measure of home inventory – dividing the number of homes for sale by contracts written in the same month. By this measure (by an measure really) detached homes hit another record low of only a 1.5 month supply, which is incredibly low. Just look at the graph. Attached homes had only a 3.0 month supply, which is at the lower end of its range and down from a 3.5 month supply last year. So condos are getting tight as well despite more units on the market – because contract activity is also way up.
Chicago Home Sale Market Times
The average market times (graphed below) reflect what you’d expect from the tight inventory situation. Detached homes are selling faster than last year – 89 days, down from 100. Attached homes are doing negligibly better than last year with a 106 day market time compared to 108 days last year.
What’s not shown below is how dramatically the median market time for detached homes has come down from last year. At 35 days it’s half of what it used to be while attached median market times have actually gone up slightly. So condos aren’t selling any faster than last year but a lot of single family homes are selling much faster.
Additional data on the Chicago real estate market like this is also available on our Web site.
#RealEstate #ChicagoRealEstate #Coronavirus
Gary Lucido is the President of Lucid Realty, the Chicago area’s full service real estate brokerage that offers home buyer rebates and discount commissions. If you want to keep up to date on the Chicago real estate market or get an insider’s view of the seamy underbelly of the real estate industry you can Subscribe to Getting Real by Email using the form below. Please be sure to verify your email address when you receive the verification notice.


