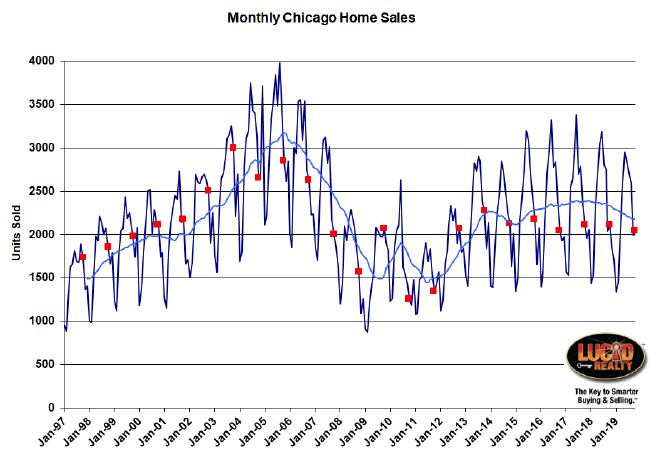
During a year in which home sales in the Chicago real estate market have been kinda slow it’s once again good news when a month like October comes in only 0.4% below last year. Compare that to an average 5.7% drop in the previous 12 months, 3 of which had double digit drops.
The graph below shows Chicago’s home sales going back to 1997 and, although it may look like this October was the lowest in 8 years, it’s really not because all the closings are not yet reported for last month. When the dust settles we should see that October was higher than 3 out of the last 7 years. The Illinois Association of Realtors no longer adjusts for closings that haven’t been reported yet so they will announce a 2.8% decline in about 2 weeks. Just ignore that and use my numbers.
Nevertheless, the light blue moving average in the graph below shows you the longer term trend and home sales have definitely been on the decline. As you’ll see in a minute other metrics of the health of the Chicago real estate market are not so bad but the decline in home sales is likely to continue into the near future.

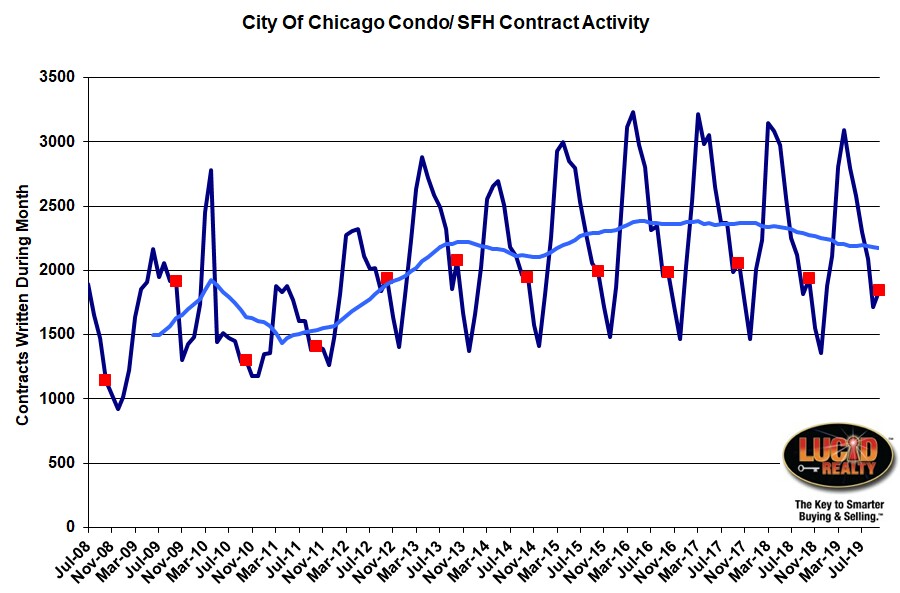
Chicago Home Contract Activity
The number of contracts being written each month in Chicago gives us a bit of a preview of what’s to come with closings and that October number did hit an 8 year low. Contract activity was 5.5% below last year so that would seem to suggest that the decline in sales is not really slowing down much.
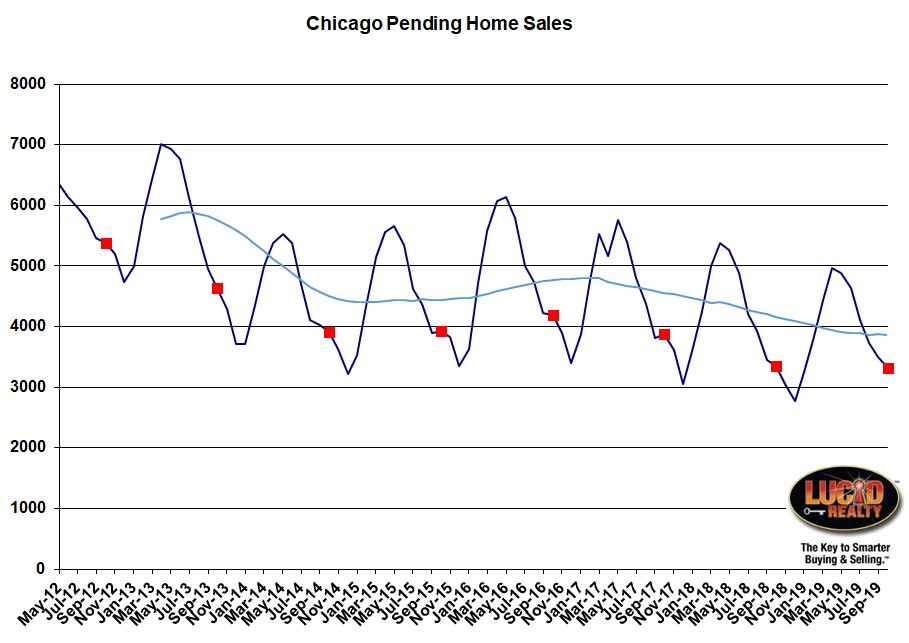
Pending Home Sales
Pending home sales is the number of homes that are in the pipeline waiting to close. Any difference between contracts written, contracts cancelled, and deals closed goes into or comes out of this pipeline and gives us another indication of what future closings are going to look like. As you can see in the graph below pending home sales have been on the decline for several years and that has actually been boosting closings a bit. However, recently it looks like this decline has finally been slowing down – October only fell by 41 units from last year – so we’re no longer going to have that source of bonus closings.
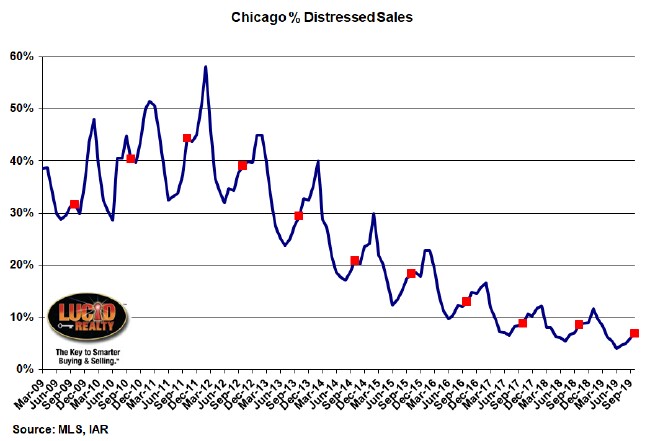
Distressed Home Sales
With the housing crash well behind us it should be no surprise that the percentage of home sales that are distressed has come way down and is obviously nearing the bottom. Yeah, we hit another low in October – 6.9% vs. 8.6% last year.
Chicago Home Inventory
If you’re selling or buying a home it’s not all that important how many homes are selling. What really matters is how many are for sale (supply/ competition) and how fast they are selling. And the number for sale needs to be looked at relative to the sales rate, which is why we express home inventory in terms of months of supply. That’s what the graph below shows.
After many years of attached (condos/ townhomes) inventory being much lower than detached inventory the lines have flipped. So attached inventory in October rose from a 4.2 month supply last year to a 4.5 month supply this year. In contrast, detached inventory actually fell from a 4.5 month supply last year to a 3.9 month supply this year. Both of those numbers are not that high and, as I pointed out last month, it’s really the higher priced condos mostly driving the attached inventory higher.
Chicago Home Sale Market Times
The other key metric that home buyers and sellers should be focused on is how long it takes to sell a home in Chicago. The graph below summarizes this historic data by looking at how long it took for homes that actually sold to go under contract. Of course, that leaves out how long homes that didn’t sell just sat on the market but…oh well.
Again, this metric doesn’t look too bad. As you would expect from the discussion above the lines for attached and detached homes have flipped in parallel with their respective inventory situations. Attached homes that closed in October took longer to sell than last year – 83 days vs. 75 days last year. And detached homes have almost exactly gone in the mirror image direction, now taking 77 days to sell compared to 83 days last year.
Visit our Web site to see other statistics for the Chicago housing market that may be of use to you and is often updated more frequently.
#ChicagoRealEstate #RealEstate
Gary Lucido is the President of Lucid Realty, the Chicago area’s full service real estate brokerage that offers home buyer rebates and discount commissions. If you want to keep up to date on the Chicago real estate market or get an insider’s view of the seamy underbelly of the real estate industry you can Subscribe to Getting Real by Email using the form below. Please be sure to verify your email address when you receive the verification notice.


