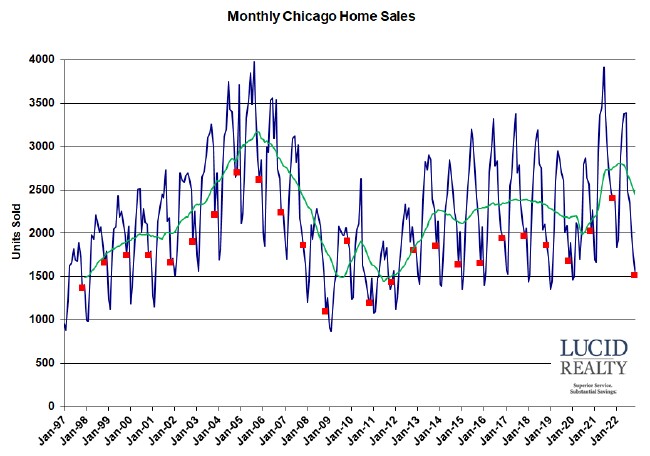
Well, I pulled the November data and the Chicago real estate market really, really sucked. Home sales hit the lowest level in 11 years, falling 34.9% from last year, which is the largest percentage decline in 12 years if you ignore the humongous decline that occurred when the pandemic first hit (that was an obvious outlier). The decline is almost equally driven by both attached and detached homes. Check out the sales history below, which has all the November data points flagged in red and a 12 month, green moving average that smooths out the seasonality. You can readily see just how ugly November was and how the moving average is plummeting back to earth.
Oh, keep in mind that when the Illinois Association of Realtors reports this in two weeks they are going to tell you that sales declined 36.5% but just nod patronizingly since I gave you the correct number.
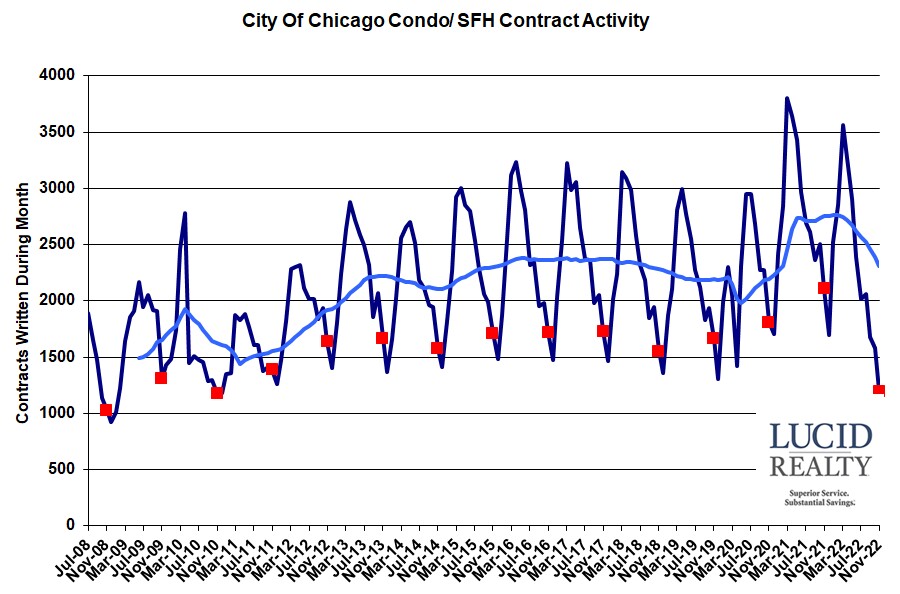
Chicago Home Contract Activity
Looking at Chicago’s contract activity for home sales won’t make you feel any better. Just look at the graph below and you can see that the contract activity fell to the lowest level in 12 years, off 43.4% from last year which is the biggest percentage drop since I’ve been tracking the data if you ignore the pandemic outlier. Since contract activity leads closings by 1 – 2 months this means sales certainly aren’t going to get any better and they could even get worse.
Pending Chicago Home Sales
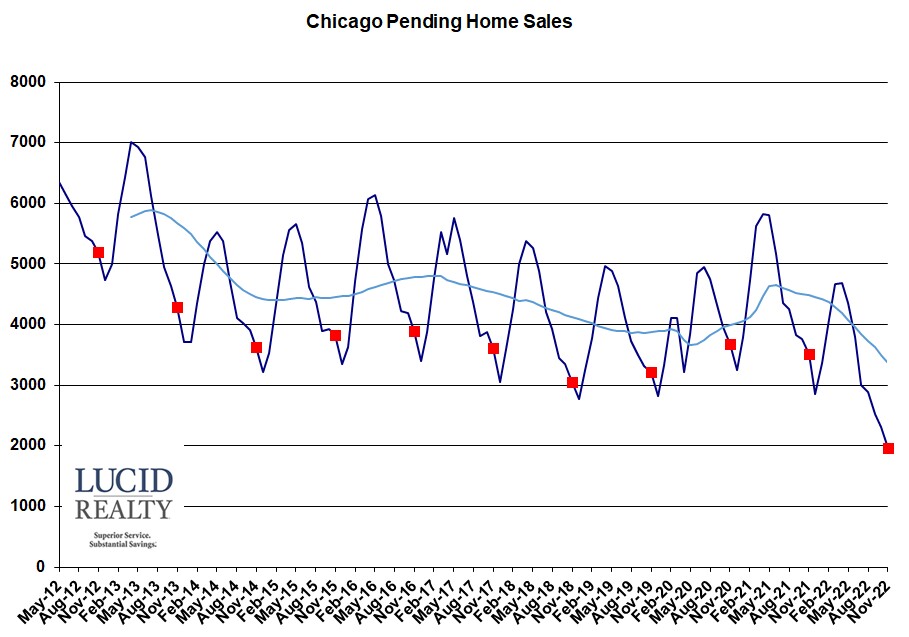
It doesn’t help matters that pending home sales keep crashing. This represents the pipeline of homes under contract that are waiting to close so it’s not good when this pipeline is drained. It’s pretty clear from the butt ugly graph below that the pipeline is lower than it’s ever been since I’ve been tracking it. It’s off 1568 units from last year and last December 2392 units sold so this decline is a big portion of next month’s closings.
Distressed Chicago Home Sales
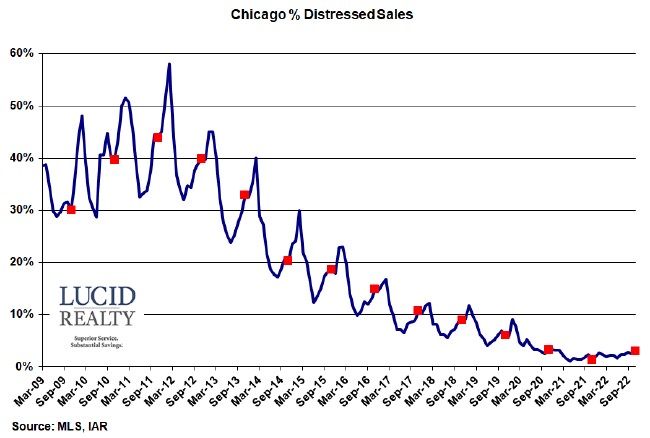
So the percentage of Chicago home sales that are distressed is clearly on the rise, hitting 2.9% in November vs. 1.4% last year. That’s still pretty low and we don’t expect it to rise much more. Sure…it’s partly on the rise due to the relaxation of the Covid restrictions on foreclosures but we’re still not seeing a huge increase in foreclosures as I’ve been pointing out in my monthly foreclosure updates.
Chicago Home Inventory
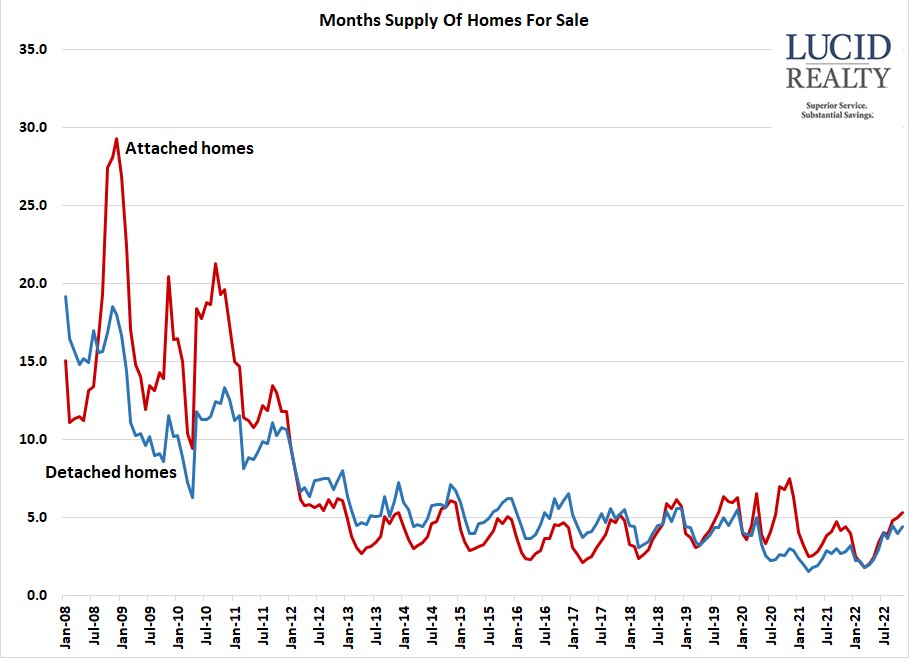
As if there weren’t already enough reasons to be concerned about the Chicago real estate market home inventory is also on the rise. We measure inventory in months of supply so the one number reflects the relationship between supply and demand and since supply is going up while demand is going down this is not good for prices. The graph below provides the historic perspective and you can see that inventory is still low relative to history but we now have 5.3 months of attached inventory compared to 4.4 months a year ago and 4.4 months of detached inventory compared to 2.8 months a year ago.
Chicago Home Sale Market Times
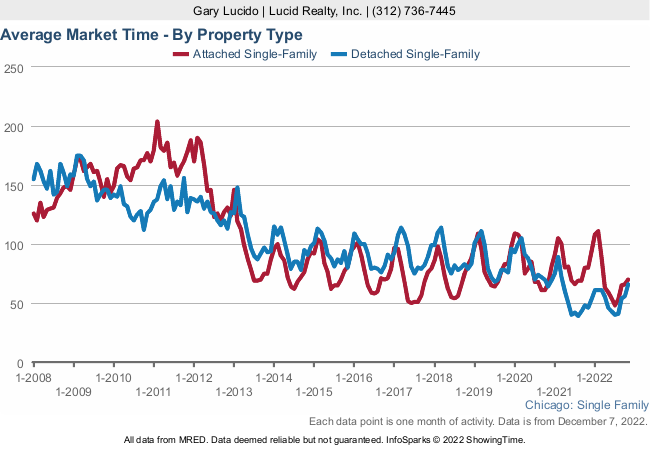
Surprisingly, the market time for attached homes in Chicago actually declined to 70 days from 80 days despite the higher inventory level. What’s not surprising is that the market time for detached homes went from 46 days a year ago to 66 days this year. But if you look at the graph below you’ll see that it’s still at the lower end of the historic range. But, no, this is not good for prices either since sellers have to lower prices to move their home in a reasonable timeframe.
