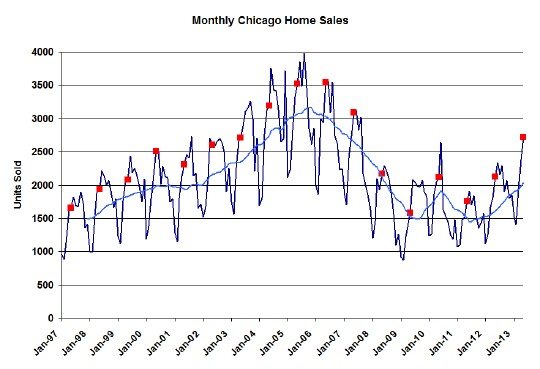
No doubt this story about how the Chicago real estate market is on a rocket is starting to get a bit boring – same old news. May home sales in the city once again leaped way ahead of last year – 34.8% on top of last years 19.6% increase over the year before that. And that’s the 23rd month in a row of year over year sales increases.
When the Illinois Association of Realtors announces the numbers two weeks from now they will report something more like 29.2% because of the the way they make their comparisons. Rest assured that my numbers better reflect what is going on. Also, they will report how median prices hit the highest level in 4 years. I don’t pay too much attention to median prices because they don’t really reflect price changes as much as they reflect mix changes.
May Chicago Home Sales
Looking at my long term home sale (closings) graph below you can see that May was easily at the highest level in 6 years, even exceeding the levels of May 2003 and it’s certainly higher than the 6 years prior to that. We can do just fine at these sales levels.
Chicago Home Contract Activity
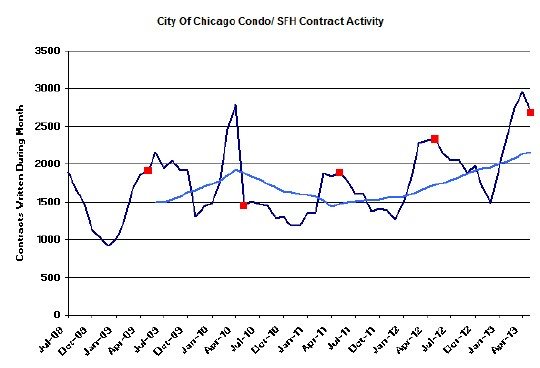
Home contract activity obviously leads the closings by a month or two. Contracts hit the highest level in 5 years and is on a nice upward trajectory so we can look forward to several more months of high closings. May contracts were 14.3% above last year after allowing for a 20% attrition rate.
In recent months homes have been closing slightly faster than contracts have been written so the backlog of pending home sales has been clearing. We are now down from April to 6933 pending contracts, which equates to a 2.5 month backlog at current close rates.
Distressed Home Sales
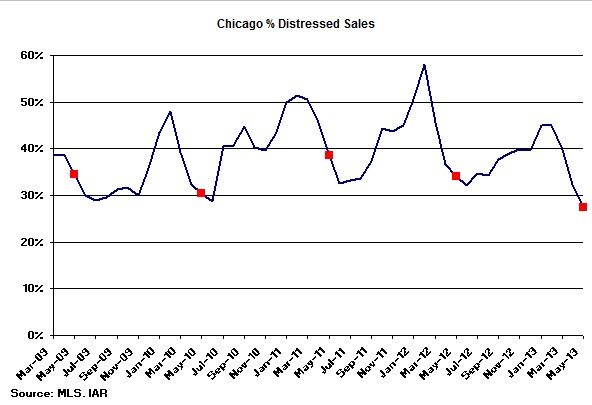
The percentage of home sales that are distressed is on a clear downward trend over the last 2 years and in May it hit the lowest level in the last 5 years at 27.5%. This is why median prices are increasing now.
Chicago Home Inventory
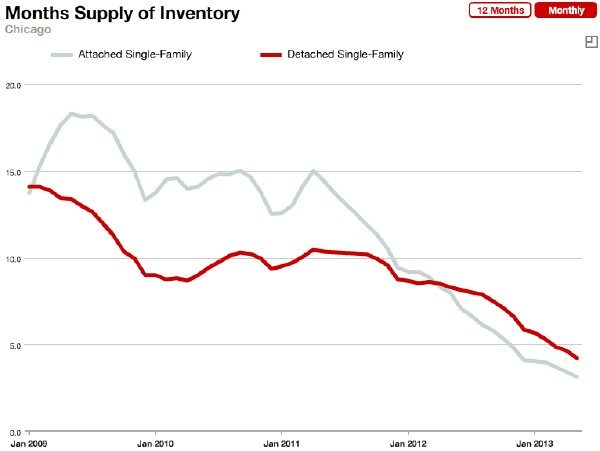
As everyone knows it just keeps getting harder and harder to find a decent home in Chicago since inventories are so low and keep getting lower every single month. In May Chicago dropped to a 3.2 month supply of condos and townhomes and a 4.2 month supply of single family homes.
Now the really observant reader will note that these numbers are actually slightly up from what I reported last month. So how can they be up but still trending downward? That’s because there’s a bit of revisionist history taking place here as the contract activity is perpetually revised downward as contracts get cancelled without closing. Contract activity is in the denominator of this calculation so activity goes down, months of inventory goes up. Nothing is easy.

If you want to keep up to date on the Chicago real estate market, get an insider’s view of the seamy underbelly of the real estate industry, or you just think I’m the next Kurt Vonnegut you can Subscribe to Getting Real by Email.


