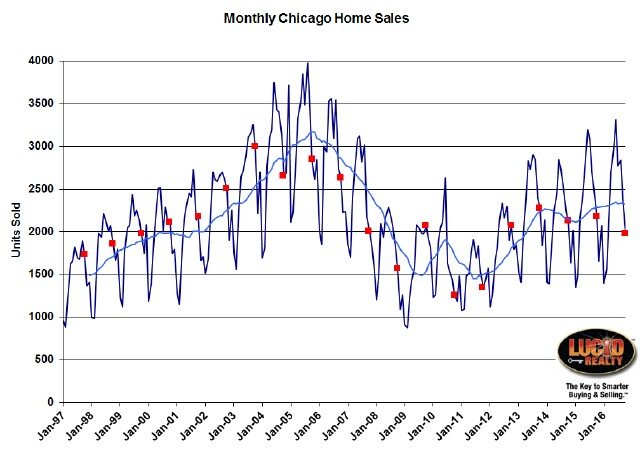
The Chicago real estate market has been flashing plenty of signs of weakness lately and October just came in with the second worst reading in 21 months – at least according to one key metric. Closings were down 6.1% from last year. You can look at my monthly sales graph below which goes back to 1997 and you can also see that this October had the lowest sales in 5 years. And looking at that blue moving average line it clearly appears that the overall sales rate is really plateauing.
Of course, the Illinois Association of Realtors numbers that will be released in about 2 weeks will look even worse. It looks like they will report an 8.8% decline.
These numbers may not be as bad as you might think, given the other data points below which suggest a myriad of extenuating factors.

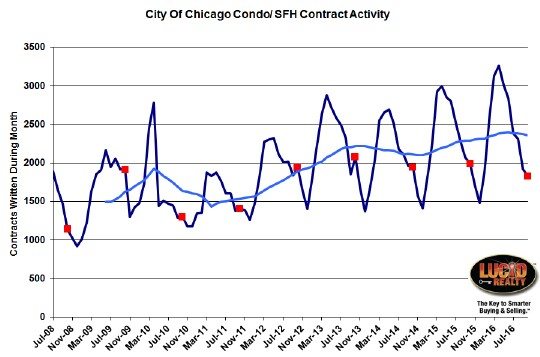
Chicago Home Contract Activity
Contract activity basically mirrors what’s going on with the actual closings right now but it gives us a preview of what to expect. That will probably also settle at the lowest October level in 5 years and the blue moving average line again suggests that the growth is just petering out. Right now I’m estimating that October contracts will be down by 8.2% from last year, which would be the largest decline in 26 months.
However, take it easy because lately fewer contracts have been disintegrating than has historically happened, which could mean that my contract estimates are too low and that could boost closings down the road (see pending home sales below).

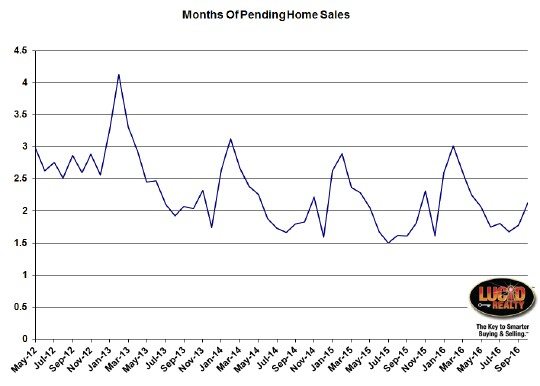
Pending Home Sales
Speaking of pending home sales, we’re actually seeing an increase in this number. At the end of October we had a 2.12 month supply of pending home sales vs. a 1.80 month supply a year ago. That’s a substantial increase. As I mentioned above it’s possible that this is somewhat driven by fewer contracts falling apart than we are accustomed to. Regardless, this many pending home sales will help goose closings over the next 1 – 2 months.
Distressed Home Sales
Once again we hit another record low in the percent of home sales that are distressed properties. Only 13.0% of October’s sales were distressed properties compared to 18.3% last October. There are just fewer and fewer distressed properties available to buy and that has proven to be a significant headwind to matching previous years’ sales.
Chicago Home Inventory
Once again home inventory levels have dropped to record lows for this time of the year and this could be another major contributing factor to the anemic sales level – i.e. there aren’t enough homes to buy. October had a measly 3.2 month supply of condos and townhomes available to buy vs. a 3.8 month supply a year ago while there was only a 4.5 month supply of single family homes compared to a 5.5 month supply last year. As you can see those are significant drops.
Chicago Home Sale Market Times
When you look at how quickly homes are selling you get a pretty clear picture of a healthy real estate market. For the homes that sold…condos and townhomes sold in a mere 69 days on average compared to 77 days last year while single family homes sold in 81 days, which was almost 2 weeks shorter than the 94 days it took a year ago. We just continue to set new records with this metric also.
#RealEstate #ChicagoRealEstate
Gary Lucido is the President of Lucid Realty, the Chicago area’s full service discount real estate brokerage. If you want to keep up to date on the Chicago real estate market, get an insider’s view of the seamy underbelly of the real estate industry, or you just think he’s the next Kurt Vonnegut you can Subscribe to Getting Real by Email using the form below. Please be sure to verify your email address when you receive the verification notice.

