For the last 12 months the Chicago real estate market has been in a sales slump. 11 of those months came in with lower sales than the previous year and roughly once every 3 months the sales decline has been in the double digit percentages. June was one of those double digit months but I just pulled the July home sales numbers and the decline was only 2.7%. That’s one of the smaller percentage drops during this down period.
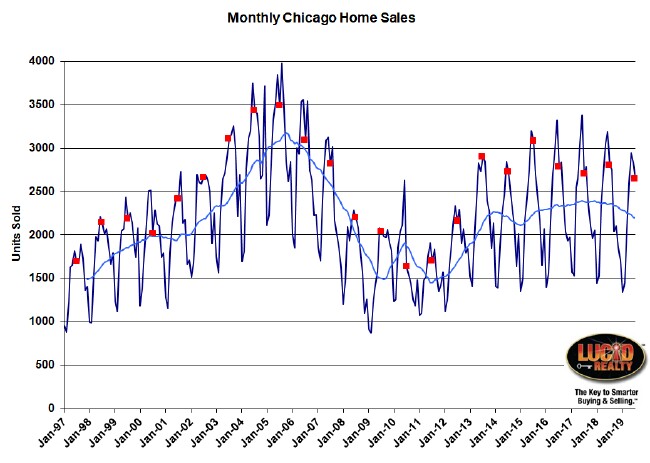
The graph below shows Chicago’s monthly home sales going back to 1997. It looks like July had the lowest sales in 7 years but that’s only because all the sales are not yet recorded. Once they come in (and it could take months) we should see higher sales than 2 years ago. However, the Illinois Association of Realtors insists on comparing these preliminary numbers to the final numbers from the previous year so they will announce a 5.3% sales decline in about 2 weeks.
One other thing to note in this graph is that the light blue moving average line provides a pretty good sense of just how flat the Chicago real estate market has been over the last 6 years or so.
Chicago Home Contract Activity
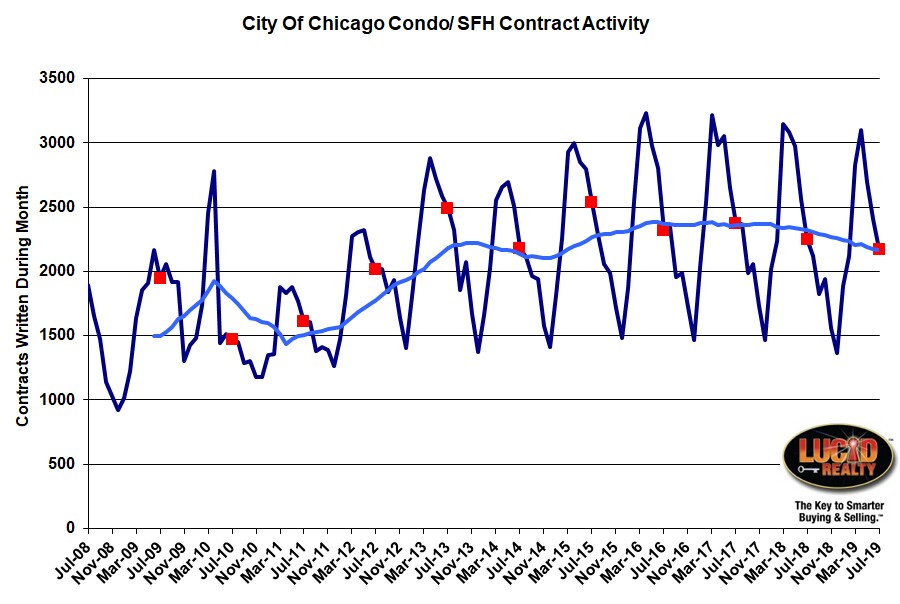
The graph below shows the monthly home sale contracts written in Chicago. These numbers give us a preview of home sales in the next month or two. As you can clearly see the moving average in this graph pretty much mirrors the moving average in the graph above. So when I see that July’s contract activity was only down by 3.8% from last year (which is also at the low end of the range that we’ve seen over the last 12 months) it tells me that August and September sales shouldn’t be too bad. Oh…they’ll be lower probably but not by double digit percentages.
Pending Home Sales
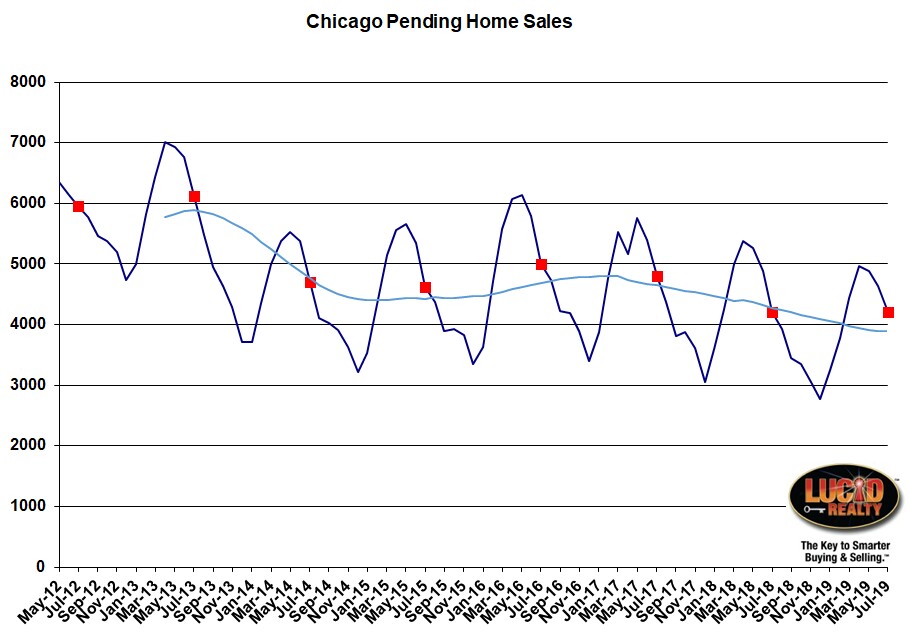
The other leading indicator of home sales is pending home sales. It represents contracts written that haven’t closed yet – kinda like a backlog of sales. Three factors drive a change in this number: 1) Contracts written cause this number to go up 2) Closings cause this number to go down and 3) Contracts that fall apart cause this number to go down. If the number of closings are high relative to contracts written the pending home sales will go down, which will likely be a drag on future closings.
The graph below shows pending home sales at the end of each month going back to May 2012. As you can see it has been trending down, which means it has actually been supplementing closings during that time period. The July number was lower than last year by only 94 units, which is one of the smaller declines in recent memory.
Distressed Home Sales
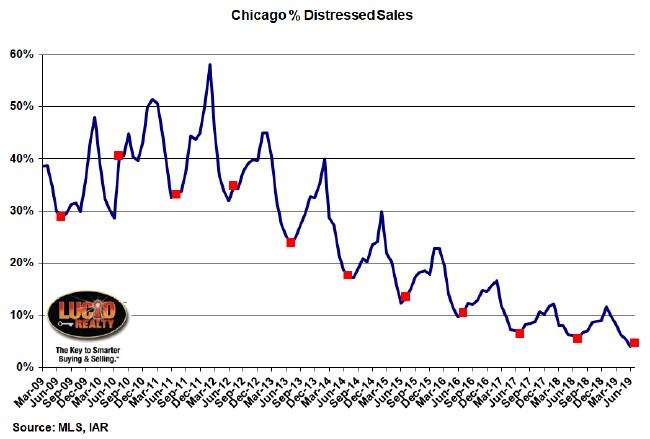
The downward trend in the percentage of home sales that are distressed continued in July, though we are inevitably reaching a bottom in this number. 4.7% of July’s sales were distressed compared to 5.5% of last July’s sales and that was up slightly from June’s 4.1%. We are now entering the time of year when this percentage increases but I doubt we will see the double digit percentages again any time soon.
Chicago Home Inventory
The inventory of detached and attached homes for sale have bee moving in opposite directions for the past year or so. It’s gotten to the point where attached inventory is getting kinda high – a 4.6 month supply in July vs. 4.1 months last July – while detached inventory is much lower – a 3.9 month supply vs. 4.4 months last year.
Chicago Home Sale Market Times
Despite the soft sales numbers homes still tend to sell pretty fast in Chicago and the pattern is consistent with the inventory levels discussed above. For instance, with the higher inventory of attached homes it’s no surprise that market times have extended from 54 days last year to 64 days this year. Conversely, detached homes sold much faster this year – in only 67 days compared to 82 days last year.
Note that this data is only calculated on homes that actually sold. So all the stale homes out there are not reflected in these numbers.
You can also visit our Web site to find additional information on Chicago’s real estate market. There you will find other market information in addition to some of the above data which is updated more frequently there.
#ChicagoRealEstate #RealEstate
Gary Lucido is the President of Lucid Realty, the Chicago area’s full service real estate brokerage that offers home buyer rebates and discount commissions. If you want to keep up to date on the Chicago real estate market or get an insider’s view of the seamy underbelly of the real estate industry you can Subscribe to Getting Real by Email using the form below. Please be sure to verify your email address when you receive the verification notice.


