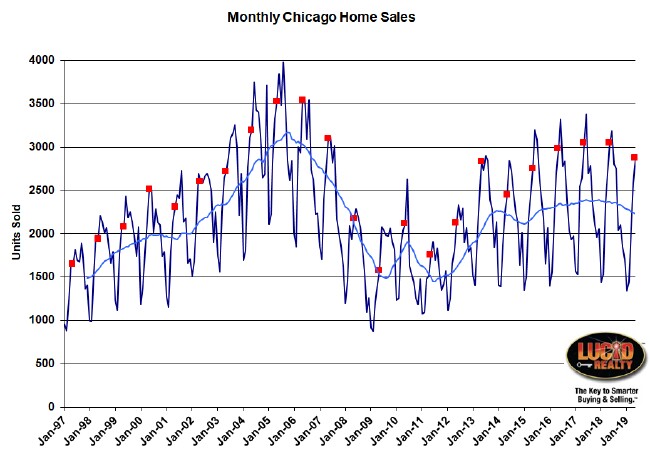
For the 9th time in the last 10 months the Chicago real estate market had lower home sales than the previous year. May came in 2.8% lower, which is actually the second lowest decline among those 9 other months. The May sales level was also lower than two years ago. However, if you look at the graph below, which has Chicago monthly home sales history back to 1997, you’ll get the impression that sales were also lower than 3 years ago. But that’s not likely to be the case since not all the sales data is in yet for the month since some realtors can’t hit a deadline.
Obviously with this many months of declining sales the moving average (light blue line in the graph) has been trending down.
When the Illinois Association of Realtors releases their sale figures in a couple of weeks they will once again exaggerate the decline, reporting it to be -5.1%.

Chicago Home Contract Activity
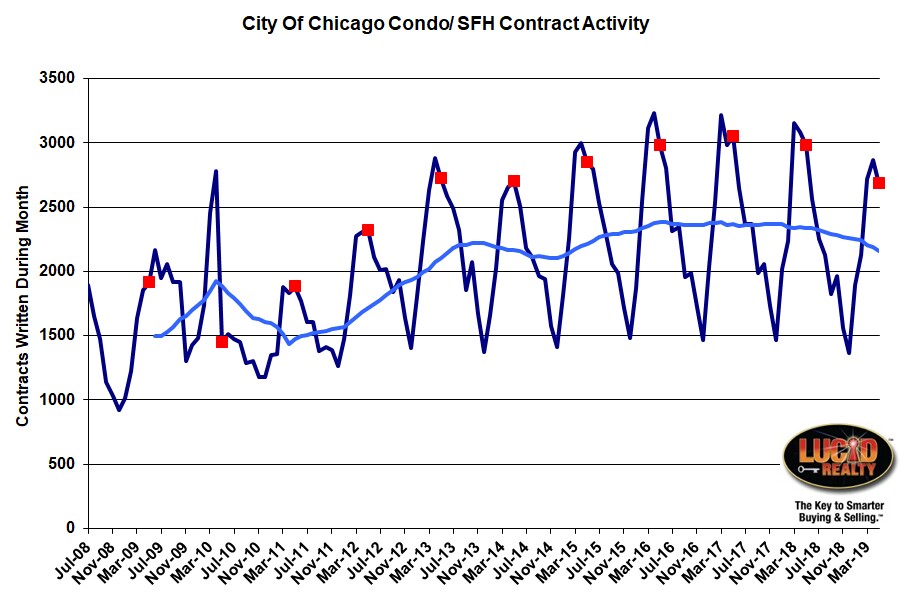
Chicago contract activity also remains weak, which is no surprise given the low sales level. I’m currently estimating that May had 10.6% fewer contracts written than the previous year and for the last 3 months the drop in contract activity has been larger than the drop in sales. More on this later. In fact, given the lower contract activity recently I was expecting much lower sales in May.
See the graph below for the historical levels of contracts written back to 2008.
Pending Home Sales
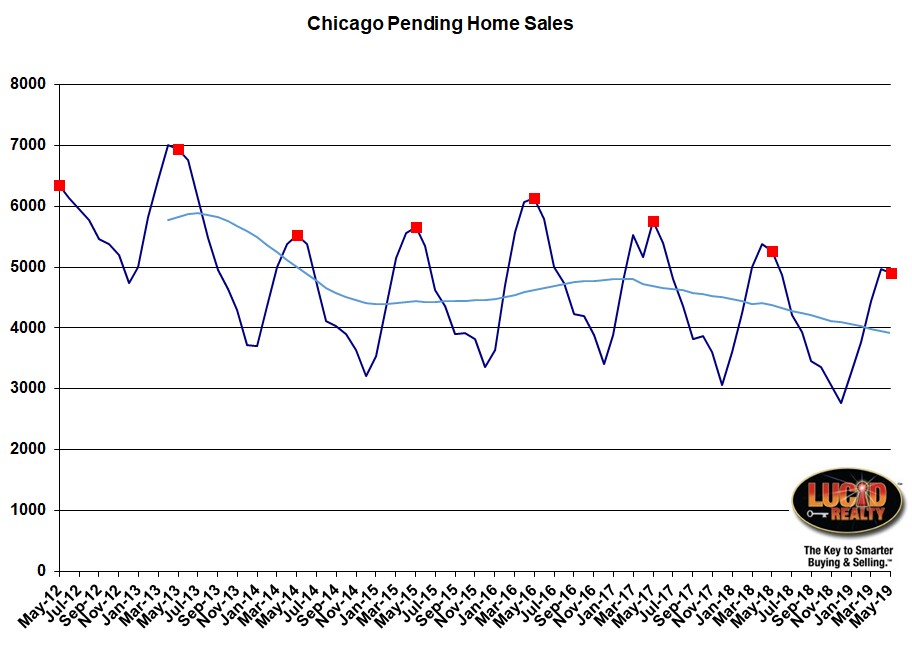
One factor that could be buffering the difference between lower contract volume and lower sales volume is pending home sales. It’s basically like a water tank with new contracts going in the top and closings coming out the bottom, not to mention the frequent withdrawals because deals just fall apart. But if you can draw down this buffer then it will temporarily boost sales despite lower volumes coming in through the top of the tank.
As you can see in the graph below pending home sales has also been on the decline for several years now. May had 375 fewer pending deals than last year. It could just be that deals are closing faster than they used to – and we have some data that indicates that this is true.
Distressed Home Sales
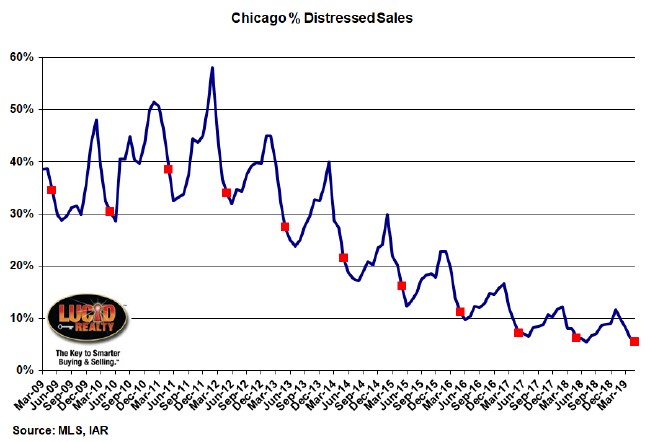
The percentage of home sales that are distressed declined once more in May, down to 5.5% from 6.2%. As you can see in the graph below it sure looks like this metric is bottoming out but it keeps surprising us with ever lower numbers.
Chicago Home Inventory
Once again, so much of the Chicago real estate story comes down to inventory – and it’s a tale of two markets going in opposite directions. Starting in February the months of supply of attached homes crossed the supply of detached homes for the first time in years. Now it’s significantly ahead with a 4.4 month supply of attached vs. 3.7 months for detached homes. Compare that to just the opposite a year ago when we had a 3.8 month supply of attached and a 4.2 month supply of detached.
So there is definitely a bit of a supply shortage with detached homes and that could be holding back sales. Attached homes now seems to have a decent supply available.
Chicago Home Sale Market Times
How long it takes to sell a home is probably the best indicator of how healthy the Chicago real estate market is and it looks pretty healthy right now – at least for detached homes which sell in 79 days, down slightly from 81 days last year. Attached homes have gotten a bit weaker which is consistent with the higher inventory levels. They sold in 70 days, which is up from 62 days last year but still not all that high.
My conclusion from this data is that we don’t have a demand problem because if we did the market times would not be as short as they are. However, keep in mind that market time data is only captured on homes that actually sell. So, with the higher inventory of condos there may be quite a few overpriced units on the market that aren’t moving and not showing up in the market time data.
You should definitely check out our Web site for additional information on the Chicago real estate market. We have some of the data above, updated on a more timely basis, along with other metrics that are important.
#ChicagoRealEstate #RealEstate
Gary Lucido is the President of Lucid Realty, the Chicago area’s full service real estate brokerage that offers home buyer rebates and discount commissions. If you want to keep up to date on the Chicago real estate market or get an insider’s view of the seamy underbelly of the real estate industry you can Subscribe to Getting Real by Email using the form below. Please be sure to verify your email address when you receive the verification notice.


