A lot of people gauge the health of the Chicago real estate market in terms of home sales which is why I always start off my monthly update with that metric. The graph below shows the monthly sales numbers going back to 1997 with all the January numbers flagged in red and a light blue 12 month moving average line. Looking at the moving average you can see that it had been on a downward trend for the last couple of years but in the last few months it might finally be flattening out. After a strong December (strong only relative to the previous year) January also did well with an 8.7% gain over last January.
That’s the second highest year over year gain in Chicago home sales in 34 months, resulting in sales that were higher than 10 out of the last 12 Januaries.
The Illinois Association of Realtors will provide their take in a couple of weeks except they will report it as a 5.9% gain. We just agree to disagree.
Anyway, I personally don’t think the health of Chicago real estate can be summed up in a single number so that’s why you need to read on to get the rest of the story. Channeling Paul Harvey there for those of you old enough to know who I’m talking about.

Chicago Home Contract Activity
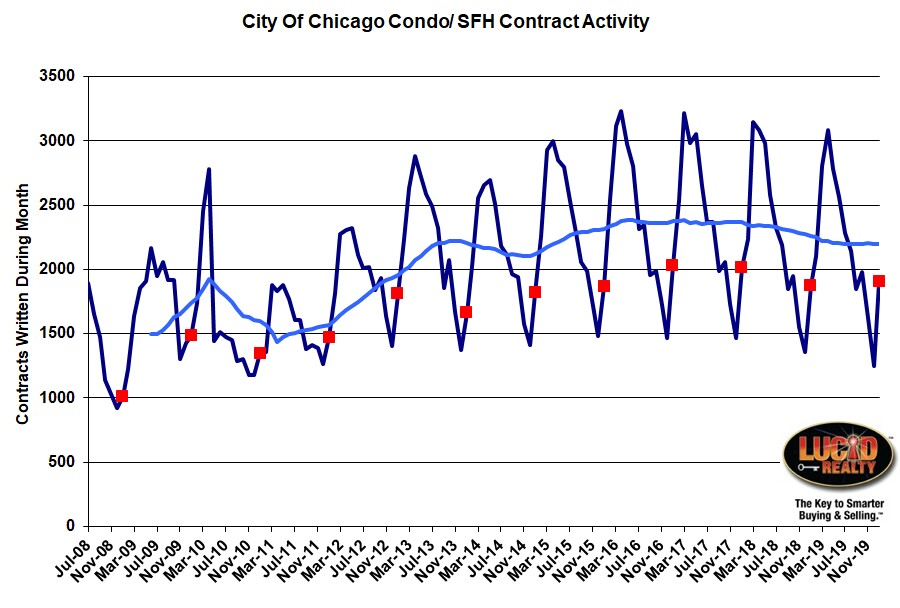
Another similar metric is the number of sales contracts written which basically serves as a leading indicator of sales volume since the contract typically precedes the closing by 1 – 2 months. The graph below mirrors the sales graph above pretty closely and also indicates a flattening. I’m estimating that January had a 1.5% increase from last year, which is admittedly not that strong and lower than 2017 and 2018.

Pending Home Sales
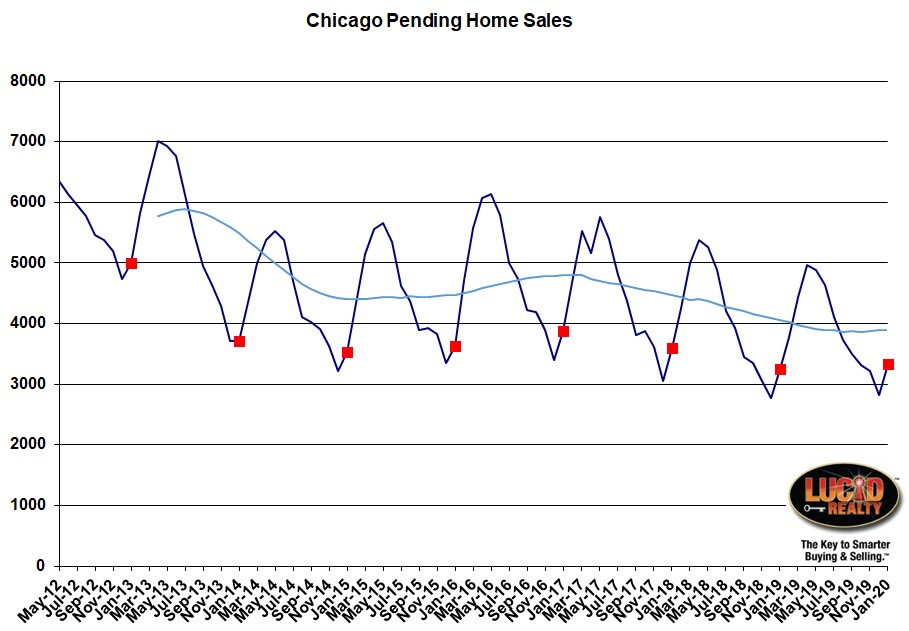
One more indicator of how future sales might materialize is pending sales – the number of homes currently under contract. A larger number means more homes waiting to close that can goose future sales numbers and a decline could indicate that closings were boosted by drawing down the backlog. As with the previous two metrics this one is also flattening out recently after declining quite a bit over a several year period. Last month was actually higher than a year ago by 71 homes.
Distressed Home Sales
Back when the housing market in Chicago was crashing a huge percentage of the sales were distressed properties. I think it peaked at 58% in February of 2012. Obviously lower is better and that number has been declining ever since. January probably represents the peak for this year and it came in at 9.1%, down from last year’s 11.7%. Hopefully, we’ve said goodbye to the double digit percentages.
Just yesterday I attended a forum with other top producers in the city and some realtors were talking about how foreclosures – especially at the high end of the market – were making a comeback. But I’m not seeing that in the data so I don’t believe it. I think realtors are often guilty of making blanket statements based upon anecdotal experiences (anecdata).
Chicago Home Inventory
Another key indicator of the health of the Chicago real estate market is the available inventory. While realtors and home buyers may, from time to time, lament the lack of inventory home sellers love to have less competition. We look at inventory in terms of the months of supply and you can see how sky high it was when all hell was breaking loose. Clearly not a healthy market. Since then we’ve seen a steady decline – except more recently for attached homes (condos and townhomes).
However, attached inventory finally dropped a bit in January from 3.3 months of inventory last year to 3.2 months this year. Detached inventory continued on it’s downward path, dropping to a new low of 3.1 months of inventory from 3.6 months last year.
Chicago Home Sale Market Times
I think the best indicator of the strength of the market (aside from prices, which I cover separately on the last Tuesday of each month) is how long it takes to sell a home. Nobody, neither buyers nor sellers, want to see homes languishing on the market. Well, OK vulture buyers like to see homes languishing. But you can see in the graph below how ugly this got during the gut wrenching period during the last decade and how much it’s improved since then. These numbers tend to parallel the inventory numbers above.
Hence, attached homes have recently begun to take longer to sell and January was once again higher than last year. For attached homes that sold it took 108 days to go under contract compared to only 98 days last year. Meanwhile, detached homes sold a little quicker this January – in only 95 days, down from 101 days last year.
For further insight into the Chicago real estate market check out our Web site.
#ChicagoRealEstate #RealEstate
Gary Lucido is the President of Lucid Realty, the Chicago area’s full service real estate brokerage that offers home buyer rebates and discount commissions. If you want to keep up to date on the Chicago real estate market or get an insider’s view of the seamy underbelly of the real estate industry you can Subscribe to Getting Real by Email using the form below. Please be sure to verify your email address when you receive the verification notice.

