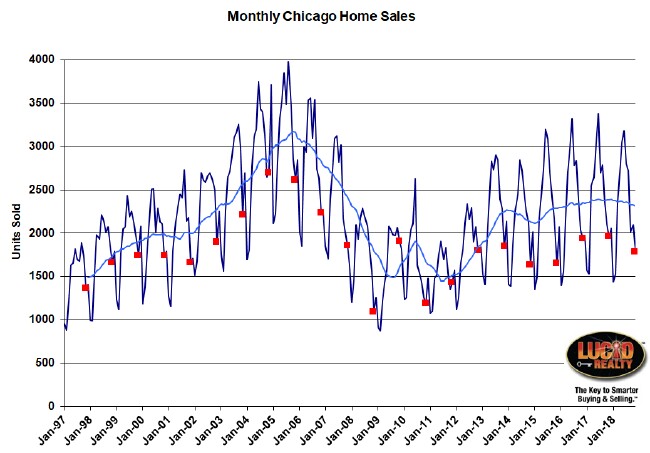
It looks like November was another slow month for the Chicago real estate market. Sales came in 6.8% below last year, which is the second largest drop in the last 8 months. Also, if you look at the graph below you’ll see that November sales were lower than 2 years ago.
When the Illinois Association of Realtors reports the sales numbers in two weeks they will claim that sales were down around 8.5% but they will be wrong because they like to compare preliminary numbers to final numbers. Go figure.
A lot of real estate people have their underwear all in a bunch these days over declining home sales. Real estate agents don’t like it because it means less business – i.e. lower commissions. Home builders don’t like it because it means lower profits for them. Interestingly, the CEO of Toll Brothers blames the media for causing a slowdown in the housing market. There might be something to that.
As you will see below the Chicago real estate market is really still pretty strong. I think the numbers support the narrative that demand is there. However, a lot of industry people, who are compensated based on volume, are confusing volume with strength and the two are not necessarily related. But that is a subtlety that may be lost on the consumer and if they hear enough reports that the market is weak then demand is going to dry up.
My position is, at least for Chicago, that lack of inventory has been constraining sales, rather than lack of demand. However, that should not be an issue for home builders because they are selling the solution to a tight supply. So if they are hurting they may actually be experiencing softening demand. But keep in mind that these guys work outside Chicago.
Chicago Home Contract Activity
One of the problems with looking just at closings is that they are impacted by how long it’s taking for deals to close. If it starts to take longer, for whatever reason, then you will see a dip in home sales even though deals may be coming together at a normal rate.
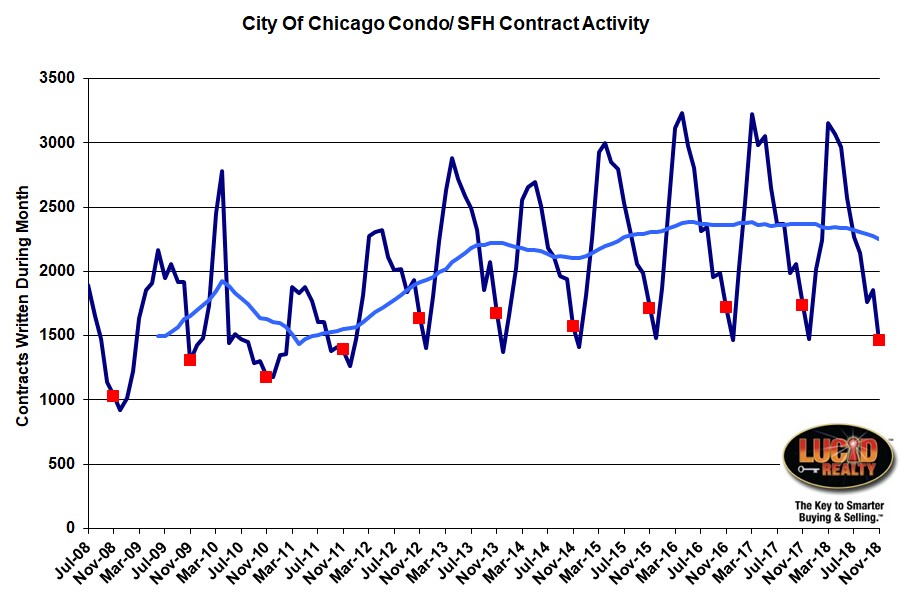
A more direct measure of real estate activity is contract activity – how many deals are coming together. I have that data graphed below with all the November data flagged in red, along with a light blue moving average line. Ultimately, these deals translate into closings – unless the deals fall apart (more on that later). The nice thing about contract activity is that when I look at that I see less volatility from month to month than I do when I look at closings. Whereas contract activity has been consistently down over last year for the last 7 months closings have been both up and down – often by significant amounts.
Of course looking at contract activity has it’s own challenges – at least the way the data is available to us. If a deal falls apart it is removed retroactively from the data. Therefore, historic numbers decline over time as contracts are cancelled and this amounts to up to 15% of the contracts written in any given month. Therefore, in order for the data to be comparable I always have to adjust for an estimate of the number of contracts that will get cancelled.
On that basis I’m estimating that contract activity in November was down by 15.6% from last year, which is a huge drop. In fact, if my estimate is correct that will be the biggest drop in about 7 1/2 years. That means that December and/ or January sales are going to be significantly depressed.
Pending Home Sales
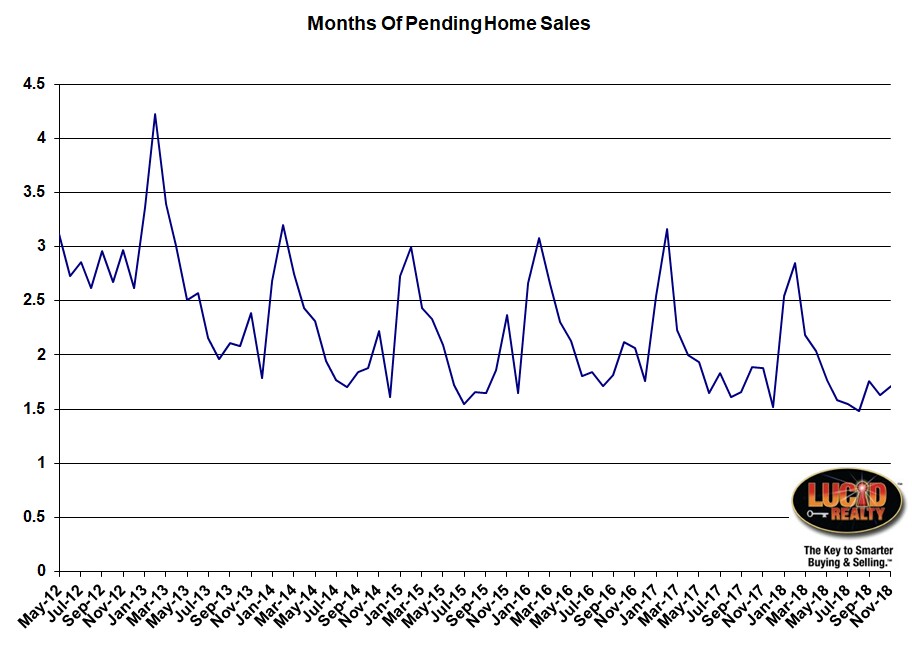
Another factor impacting how many deals actually close in a given month is pending home sales. It’s really the buffer between contracts and closings. So, if more deals close than contracts written this buffer will shrink.
I look at Chicago’s pending home sales in the graph below in terms of the months of supply of closings – how many months of closings could you feed without any further contracts being written. In November that number shrank from 1.88 months last year to 1.70 this year. That shrinkage means that November closings were supplemented by deals already in the pipeline. And since the pipeline has to be rebuilt at some point that is going to serve as a damper on sales at some point in the future.
Distressed Home Sales
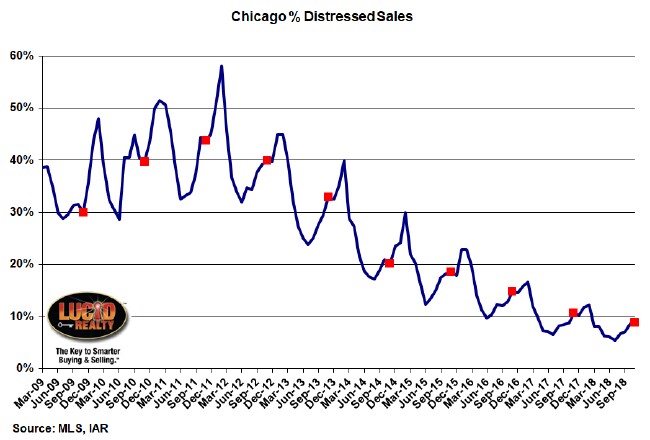
The percentage of home sales that are distressed properties hit another 10 year low in November as you can see in the graph below. From 10.7% last year we hit just 8.9% this year. As you can tell from tracking the red flags we are clearly hitting the lower limit of this number.
Chicago Home Inventory
When you look at the inventory of homes for sale you can see how it’s likely that that’s depressing sales as opposed to weak demand. The inventory of detached homes fell to a mere 3.8 month supply from 4.5 months last year. On the other hand the inventory of attached homes (condos and townhomes) actually rose to a 3.7 month supply from a 3.3 month supply. Both numbers are considered pretty low and indicative of a seller’s market.
Chicago Home Sale Market Times
Another metric that gives me considerable comfort in the strength of the Chicago real estate market is how long it’s taking to sell homes. As you can see in the graph below it’s a lot faster than it has been historically for both detached and attached homes. Detached homes that sold in November did so in only 78 days, faster than the 89 days it took last year. It is taking slightly longer to sell attached homes this year – 82 days vs. 76 days last year – and note that the lines for the two types of homes actually crossed last month. It took 4 days longer to sell a condo/ townhome than a detached home. But both numbers are still pretty low on a historic basis.
Our Web site also has additional data on Chicago area real estate that we keep updated so you can check it out between monthly updates.
#RealEstate #ChicagoRealEstate
Gary Lucido is the President of Lucid Realty, the Chicago area’s full service real estate brokerage that offers home buyer rebates and discount commissions. If you want to keep up to date on the Chicago real estate market, get an insider’s view of the seamy underbelly of the real estate industry, or you just think he’s the next Kurt Vonnegut you can Subscribe to Getting Real by Email using the form below. Please be sure to verify your email address when you receive the verification notice.


