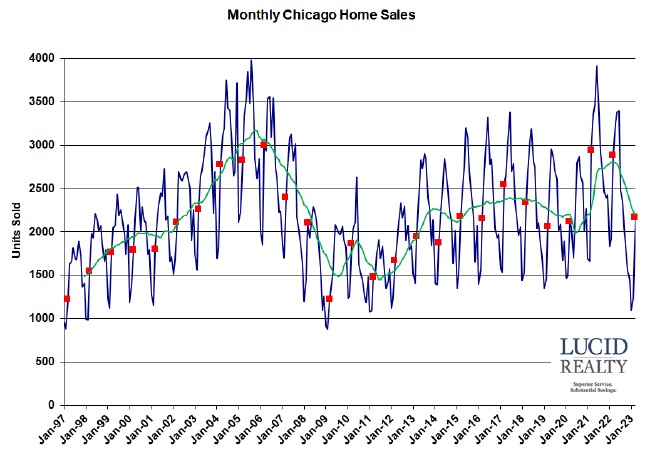
Although the headline might be that home sales declined by 23.3% in March vs. last year the reality is that the Chicago real estate market is kinda back to normal. Check out the graph below of monthly home sales and note that I’ve flagged all the March sales with red dots and I’ve included a green, 12 month moving average. 2021 and 2022, in the wake of the pandemic, were really outliers – on the high side. On the other hand last month was actually more in line with the previous 6 or even 8 years. This is a significant departure from several consecutive months of setting 12 – 14 year lows in home sales and this is the smallest decline in the last 6 months. Of course, I can’t say definitively if this is a new pattern or just an anomaly. More on this in the next section.
It’s worth noting that the decline in home sales was driven much more by an attached home sales decline than a decline in detached home sales. The percentage drop in attached home sales was roughly twice the drop in detached sales.
Please note that when the Illinois Association of Realtors releases the official numbers in a week or two they are going to report a 24.9% decline in home sales.
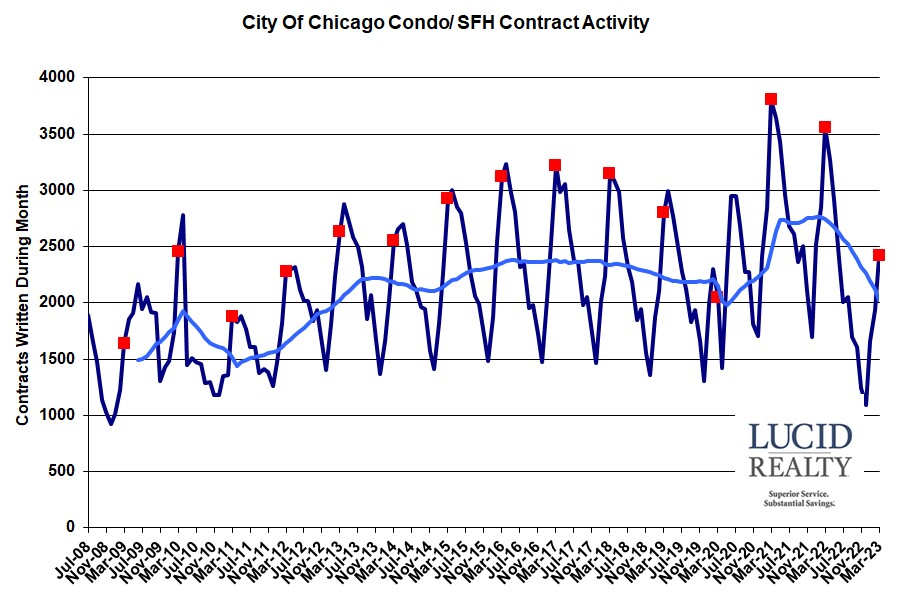
Chicago Home Contract Activity
This slightly more optimistic outlook for the Chicago real estate market could be a bit premature because contract activity is still coming in rather low. In fact March activity was off from last year by 32.1%, bringing the number of contracts written to the second lowest level in the last 12 years. So it’s entirely possible that April sales are going to once again see a much larger percentage decline in home sales which could push the number of closings well below recent historic norms once again.
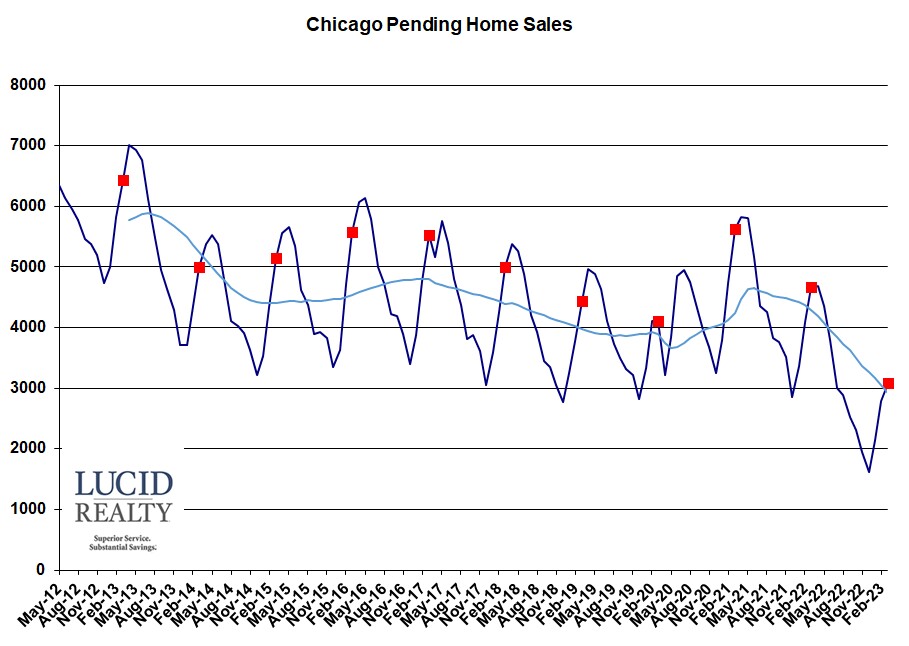
Pending Chicago Home Sales
The number of pending Chicago home sales also is not encouraging with another large year over year decline of 1582 units. That’s another record low since I’ve been tracking the data and it’s equivalent to almost half of last April’s closings.
Distressed Chicago Home Sales
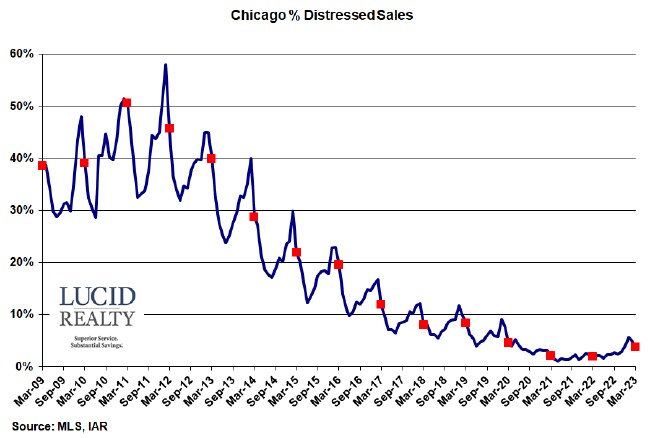
We’ve reached the part of the year when the percentage of home sales that are distressed comes back down to earth. In March 3.7% of home sales were distressed, compared to 1.9% of last year’s sales, and you can see how that’s lower than this year’s seasonal peak. Just eyeballing the graph below it sure looks like we’re flattening out.
Chicago Home Inventory
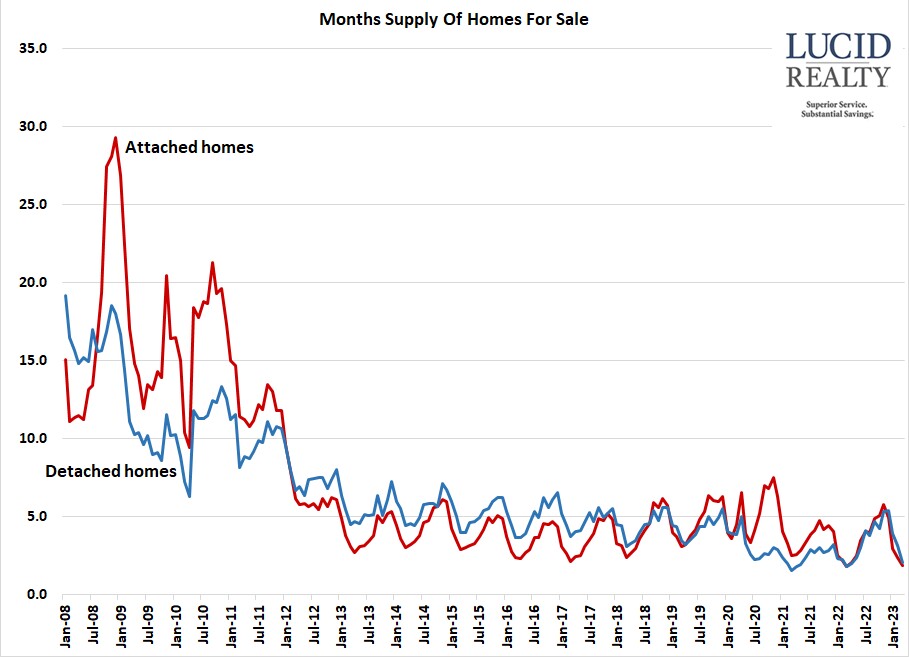
Perhaps the best thing we can say about the Chicago real estate market is that the supply of homes remains rather tight relative to demand and that is good for home prices. In the graph below you can clearly see that the months of supply of both attached and detached homes is at the lower end of the historic range. March’s 1.9 month supply of attached homes was only a smidgen higher than last year’s record low of a 1.8 month supply and this might explain why attached home sales were so low. While the 2.1 month supply of detached home inventory was slightly higher than the previous 2 years that is still a really low level of inventory.
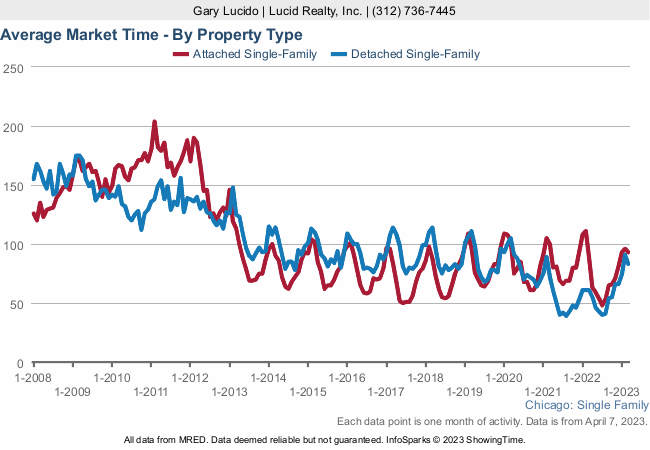
Chicago Home Sale Market Times
Therefore, it’s not all that surprising that the time it took to sell an attached home rose only slightly to 93 days from 88 days last year. What is surprising is that detached homes took 84 days to sell last month and that’s substantially up from last year’s 61 days even though inventory remains rather tight. But looking at the graph below it does appear that this is still historically low for detached homes.
