Last month I pointed out that the Chicago real estate market keeps bouncing between multi-year lows and highs in home sales from one month to the next. It was the same story for January and since I used the yo-yo analogy last month I’m going with the roller coaster theme this month.
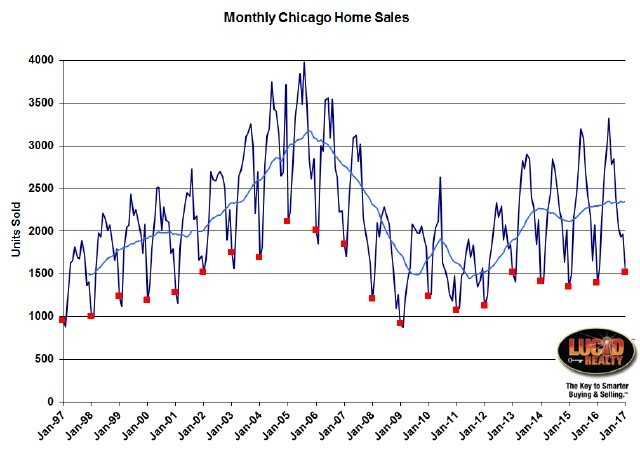
January came in with really strong sales after a weak showing in December. Sales were up 12.0% over last year which pushed January to the highest home sales level seen in 10 years. Looking at the graph below, with all the Januaries flagged in red, you might not be able to tell that sales were indeed higher than January 2013. But that’s because the January 2017 numbers are preliminary and we’re still missing a handful of sales – enough to easily push us past the 2013 sales numbers.
That year over year increase is also the second highest percentage gain in the last 18 months. However, when the Illinois Association of Realtors reports the numbers in a couple of weeks they will report it as an 9.2% increase in sales because of a flaw in their methodology.
Once again, given all this month to month variation in the sales gains I think it’s crucial to watch the light blue 12 month moving average line in the graph below. It still seems to be indicating that sales have plateaued.
Chicago Home Contract Activity
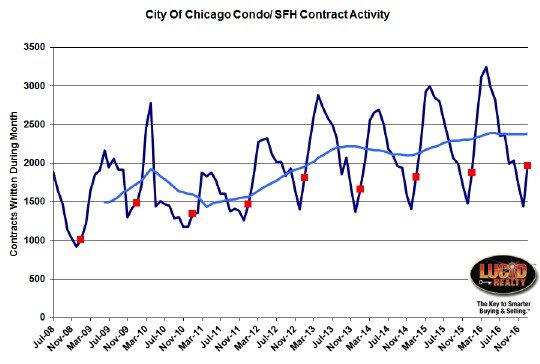
Another indication that activity has plateaued is the contract activity which seems to be less volatile than the closing data. It’s certainly less dependent on the calendar. For example, people write offers when they feel like writing offers. However, closings get bunched on Fridays and the last day of the month.
So if you look at my contract activity graph below, with all the Januaries flagged and a 12 month moving average, you can see how activity has leveled off, though this was the highest January in 9 years and up 5.0% from last year.
Pending Home Sales
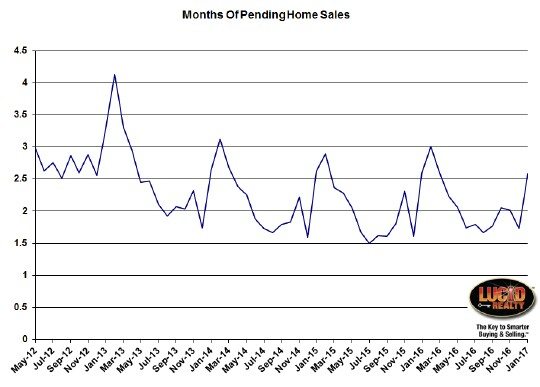
Pending home sales really do tell us a lot about what we can expect for future sales (closings). For instance, I had mentioned last month that there had been a substantial uptick in this metric and that we could look forward to that goosing sales going forward. I think we got the expected effect of that in January.
At this point pending home sales at the end of January were 2.54 months worth of closings, down only slightly from last year’s 2.60 month supply so I’m not looking for any help from this going forward.
Distressed Home Sales
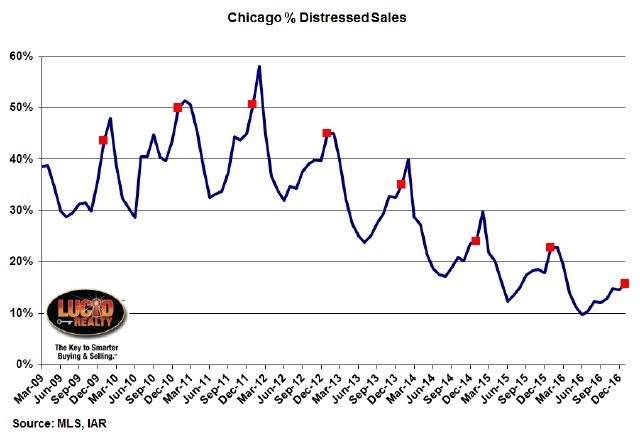
It’s the same old story with distressed home sales. As a percentage of the total it keeps hitting new lows. January came in at 15.9% vs. 22.8% last year.
Chicago Home Inventory
The inventory of homes available for sale in Chicago continues to hit new lows and incredibly low levels at that. At the end of January there was only a 2.4 month supply of condos and townhomes available for sale compared to 2.9 months last year and only a 3.8 month supply of single family homes available vs. a 4.4 month supply last year.
The inventory picture for single family homes varies greatly depending upon price point. As you get above $1 MM the inventory of homes for sale is much higher and actually rising.
Chicago Home Sale Market Times
Consistent with the extraordinarily low inventories, the market times for homes that actually sell remain low and are continuing to decline in some cases. Condos and townhomes sold in 97 days, only 1 day faster than last January, but single family homes sold in only 92 days, which is significantly faster than the 109 days that it took last January.
#RealEstate #ChicagoRealEstate
Gary Lucido is the President of Lucid Realty, the Chicago area’s full service discount real estate brokerage. If you want to keep up to date on the Chicago real estate market, get an insider’s view of the seamy underbelly of the real estate industry, or you just think he’s the next Kurt Vonnegut you can Subscribe to Getting Real by Email using the form below. Please be sure to verify your email address when you receive the verification notice.


