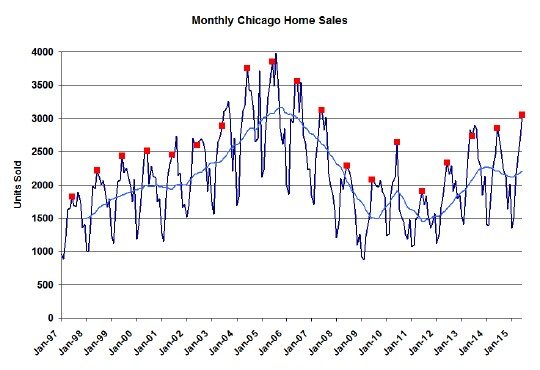
The Chicago real estate market hit another recent record in home sales for June. In the graph below I’ve flagged all the Junes as red squares and the blue line is a 12 month moving average. As you can see this year was the highest level in 8 years and, in all likelihood, it will actually prove to be a 9 year record when all the sales are finally recorded. So for the time period I’m tracking there were only 4 years higher – maybe just 3.
In two weeks the Illinois Association of Realtors will come out with the official release that shows a 9.2% increase over last year but in reality this June is up 12.6% – another double digit growth month.
Chicago Home Contract Activity
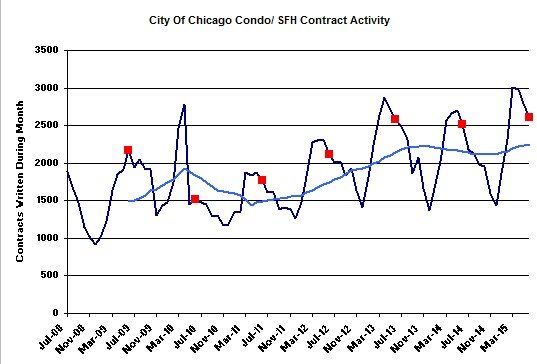
The sales contract activity doesn’t seem that strong though – only up around 1.3% over last year. But I actually have reason to believe that my estimate is a bit on the light side. It could end up closer to 10% once we have a better handle on contract terminations. It takes about 4 months for most of that effect to work it’s way through the system.
The graph below shows the longer term trend and, since closings in any month are the result of contracts written over several previous months, the blue moving average line is particularly relevant. You can see that it’s drifting up after dipping through the fall and winter.
Pending Home Sales
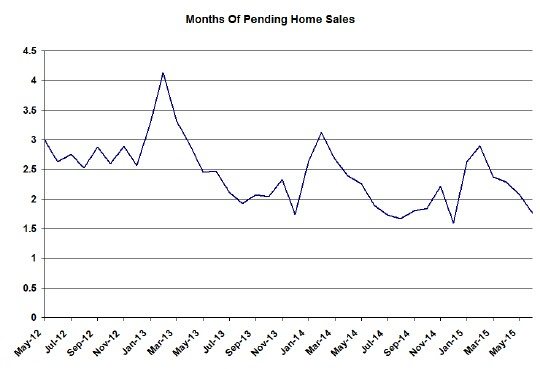
So clearly the difference between closings and contracts is going to come out of pending home sales. The graph below reflects that in terms of months supply of closings and it is drifting down a bit relative to last year. We ended June with a 1.7 month supply of pending home sales vs. last year at 1.9 months. It’s admittedly not a huge effect.
Distressed Home Sales
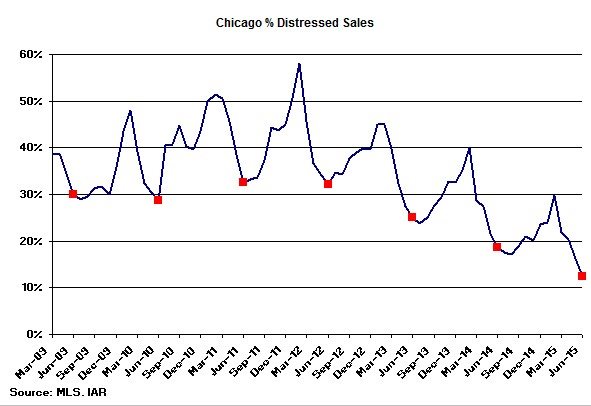
The decline in the mix of distressed home sales has been dramatic. Once again we hit another record low over the time period that I’ve been tracking and at 12.4% we are close to 1/3 of the level we were at during the worst post-bubble years. And the trend is still steep. As I like to point out, once you remove distressed sales from the equation the growth of non-distressed sales becomes even more impressive – up 21.4%.
Chicago Home Inventory
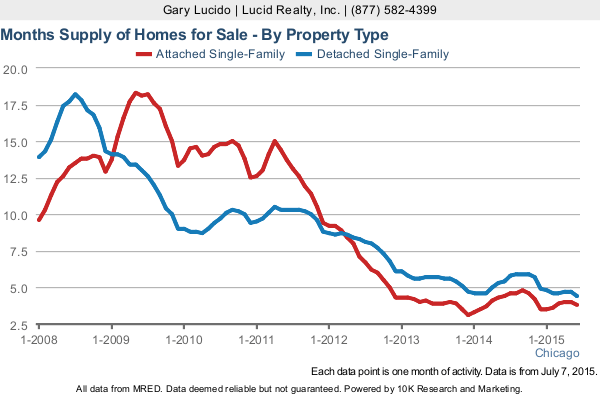
The home inventory story is just incredible. You wouldn’t think it could go any lower but it still does. The inventory of condos and townhomes dropped to 3.8 months supply vs. last year’s 4.4 months and detached single family homes hit 4.5 months vs. last year’s 5.4 month. Yet certain homes just sit and sit on the market – see market times below.
Chicago Home Sale Market Times
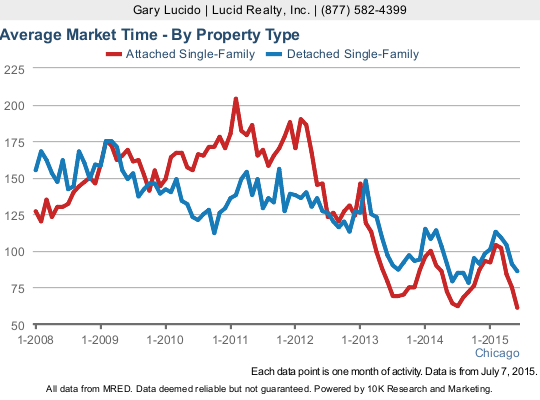
With inventories so incredibly low you would think that properties would be flying out the door. However, that’s only true for some properties. Apparently, the prices aren’t attractive enough to move properties with perceived shortcomings (location challenges, older finishes, less than desirable layouts, etc…). Another way of saying this is that buyers aren’t motivated enough to compromise. And yet another way of saying this is that prices aren’t moving up enough to make these challenged properties attractive yet.
The average market time for condos and townhomes did decline only slightly from last year – down to 61 days from 64 days last year. However, the market time for detached single family homes actually went up to 86 days from last year’s 79 days.
#realestate #chicagorealestate
If you want to keep up to date on the Chicago real estate market, get an insider’s view of the seamy underbelly of the real estate industry, or you just think I’m the next Kurt Vonnegut you can Subscribe to Getting Real by Email. Please be sure to verify your email address when you receive the verification notice.
