So, in a couple of weeks you’re going to hear the Illinois Association of Realtors say that the Chicago real estate market experienced a little increase in home sales activity in February compared to last year. 1.5% is my guess as to what they are going to announce. Of course, my own calculated percentage is more accurate. I come up with 3.4%. The only thing is that this February had an extra day. It’s called leap year. So after you adjust for that you come up with basically flat sales to last year.
Then you can compare February’s sales with the previous years’ sales and you will see that it was lower than the 4 prior years. That’s apparent in the graph below which has all the February data points flagged in red. There’s also a light blue moving trend line that smooths out the seasonality and shows you how sales activity has been trailing off. Maybe there is a small uptick in the last two months but February was a disappointment.
Chicago Home Contract Activity
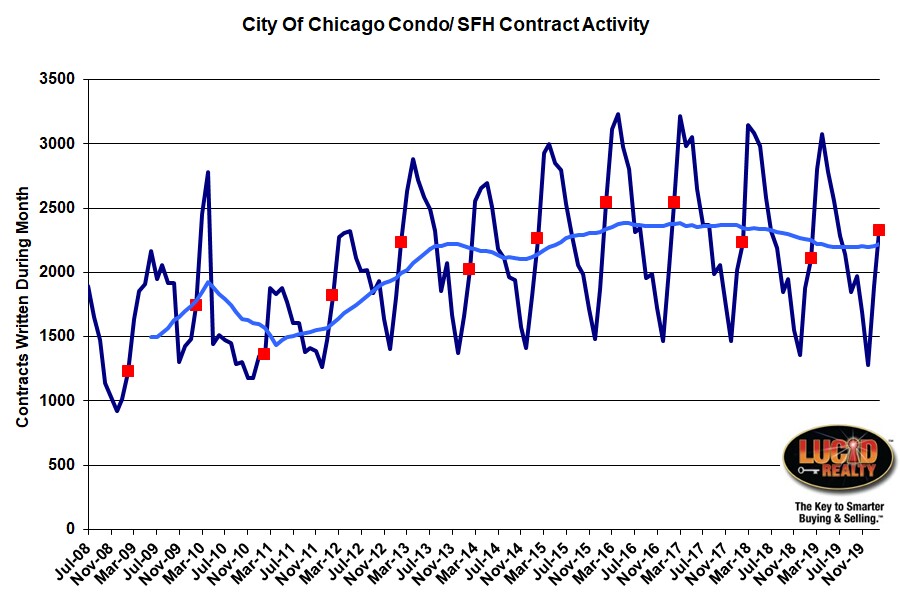
But there were a couple of bright spots in February. For instance, contract activity picked up by 10.4% from last year, which is the strongest percentage gain in 4 years. You can see that in the graph below. Of course, contract activity was only higher than the last 2 years. 2016 and 2017, on the other hand, were much stronger.
Pending Home Sales
So where did all those contracts go? They obviously didn’t result in sales – yet.
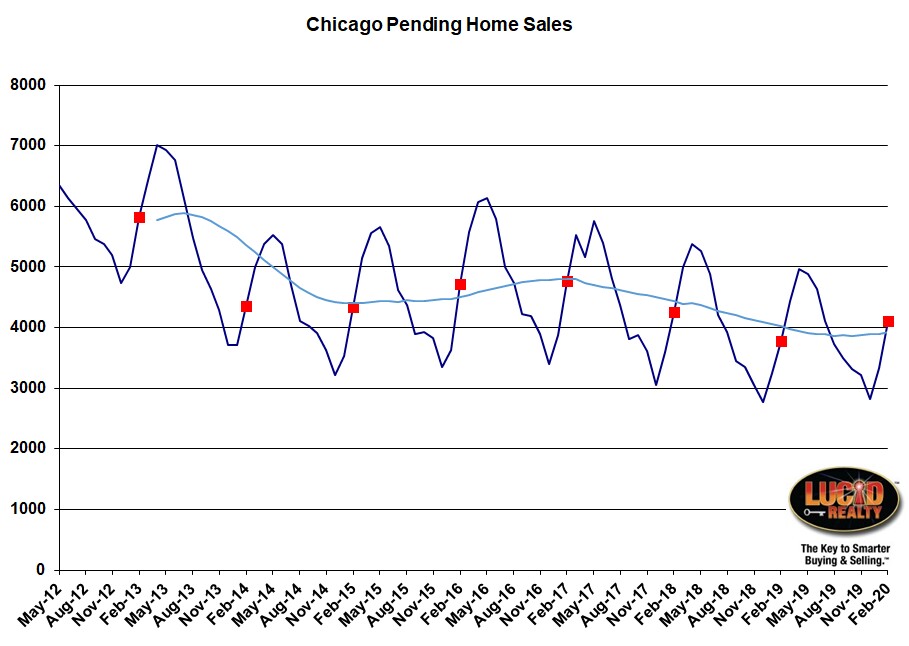
That’s what pending home sales are all about – basically contracts to purchase homes that haven’t closed yet. And if you look at the graph below you’ll see that pending home sales were up over last year – by 342 units. That’s pretty significant in light of the fact that pending home sales have been on the decline for many years. So there was actually more activity in February but not all the contracts have closed yet. With this pipeline expansion subsequent months should be stronger than their activity might merit.
Distressed Home Sales
The percentage of home sales that are distressed continues to hit new lows. It looks like we did peak in January, as expected, and we peaked in the single digits for the first time since I’ve been tracking the data. Unless we hit some kind of recession caused by…I dunno…the spread of some kind of plague…I don’t think we’ll be seeing double digit percentages again. February came in at 7.6%, down from 9.8% last year. And I keep thinking we’re bottoming out – just look at the graph – but we somehow manage to keep finding new lows.
Chicago Home Inventory
Detached home inventory has been steadily declining for years now and February was no exception. We hit a 3.0 month supply, down from 3.7 months last year. That’s significant. And attached inventory has finally begun to drop after rising for the last couple of years. It’s now at a 3.4 month supply, which is down from 3.7 months last year – still higher than detached inventory.
Chicago Home Sale Market Times
Chicago homes are definitely selling faster than last year but not by as much as I would expect given how much inventory has declined. Detached homes that closed in February took 101 days to go under contract compared to 106 days last year. Attached inventory also saw a decline to 108 days, down from 109 days last year.
If you are interested you can find a bit more Chicago real estate data on our Web site. Even if you are not interested you can find it there.
#RealEstate #ChicagoRealEstate
Gary Lucido is the President of Lucid Realty, the Chicago area’s full service real estate brokerage that offers home buyer rebates and discount commissions. If you want to keep up to date on the Chicago real estate market or get an insider’s view of the seamy underbelly of the real estate industry you can Subscribe to Getting Real by Email using the form below. Please be sure to verify your email address when you receive the verification notice.


