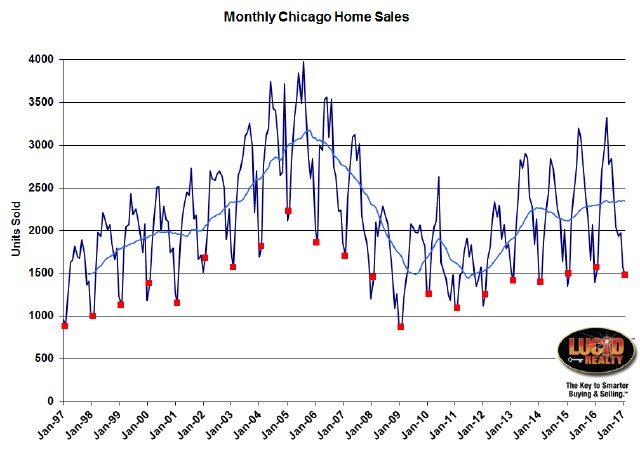
The Chicago real estate market is continuing with the yo-yo theme in February after January hit a 10 year high in home sales. February sales, in fact, were down 2.6% from last year, repeating the pattern of the last few months where we alternate between positive and negative sales changes.
Look to the graph below, with all the Februaries flagged in red and a blue moving average line, to see the long term trend in homes sales. As you can plainly see Chicago home sales have not done that much in the last 4 years. I’m sure that the record low inventory levels (see graphs and discussion below) have a lot to do with it.
When the Illinois Association of Realtors reports their numbers in two weeks they will show Chicago home sales down 5.0% from last year as a result of a minor flaw in their methodology.
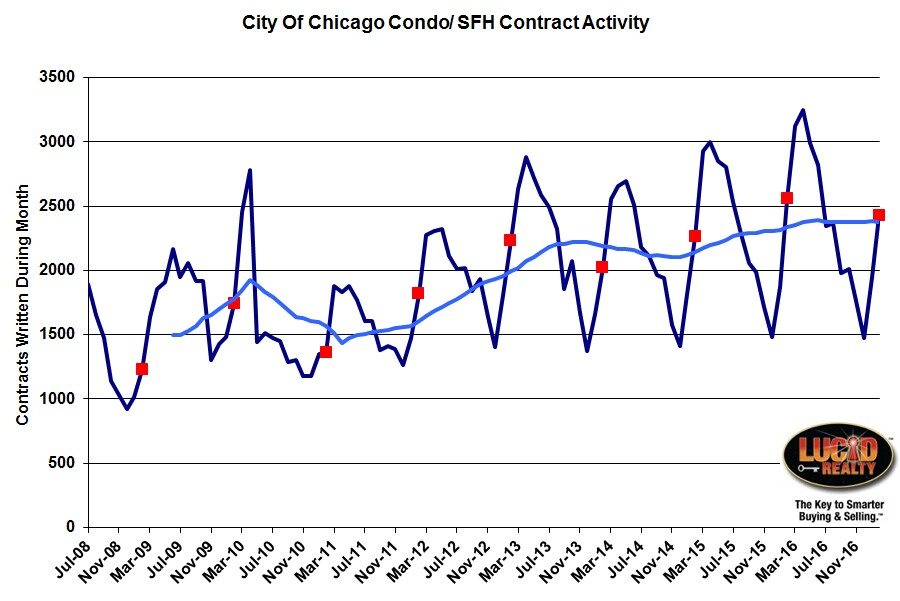
Chicago Home Contract Activity
Similarly, home contract activity has been relatively flat over the last 4 years as shown in the graph below. I’m estimating that February’s contracts were down 5.4% from last year. Since contract activity feeds closings and is running so flat it’s no wonder that home sales are so unremarkable.
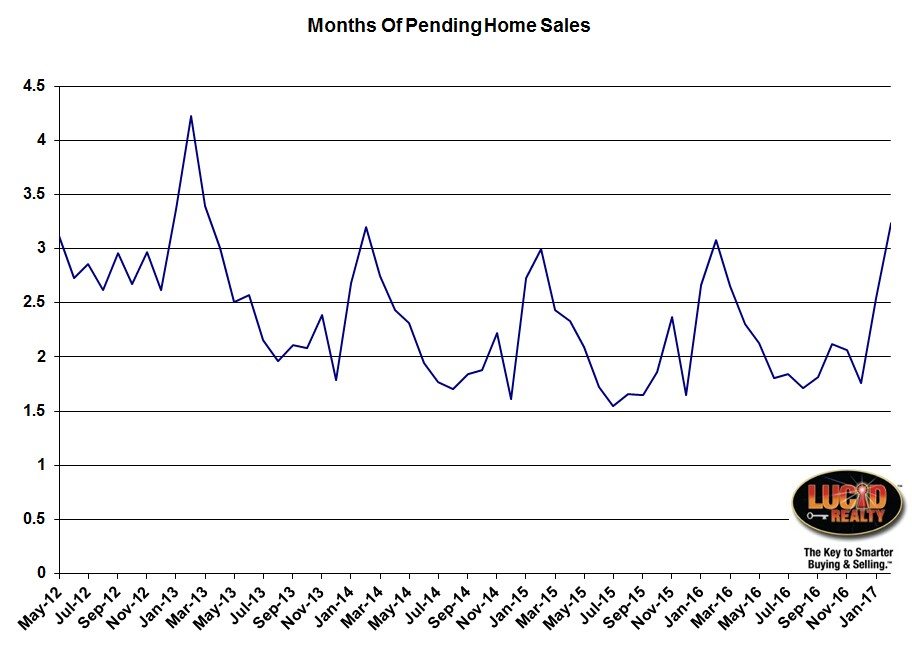
Pending Home Sales
One thing that probably ate away at February’s home sales was the fact that pending home sales rose a bit – from a 3.08 month supply last year to a 3.20 month supply this year. In other words, the number of homes closed was lower than the number of contracts written – i.e. some of the contracts will close in later months. Of course, this boosts future sales numbers.
In addition, we started February with a lower level of pending home sales than last year so we were starting behind to begin with.
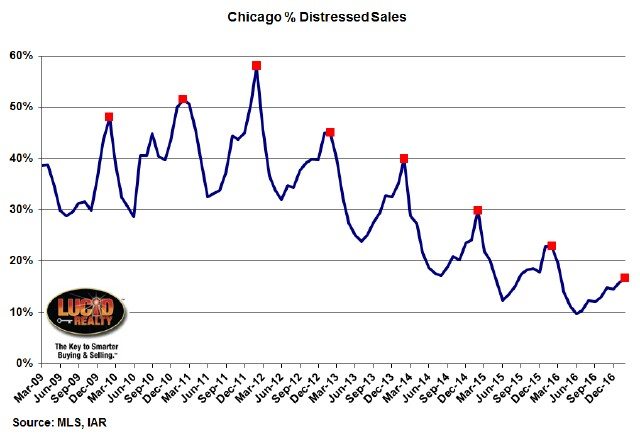
Distressed Home Sales
Once again the percentage of home sales that were distressed hit an 8 year low. Only 16.7% of February’s sales were distressed compared to 22.9% of last year’s sales.
Chicago Home Inventory
The available inventory of homes for sale continues to hit utterly ridiculous lows. February ended with a mere 2.6 months supply of condos and townhomes vs. 3.1 months last year. Meanwhile, the supply of single family homes dropped to a 3.9 month supply, down from 4.5 months last year.
Once again I need to point out that the single family home inventory picture varies widely depending upon neighborhood and price point with a bit of a glut at the upper end – and it’s getting worse.
Chicago Home Sale Market Times
Surprisingly, the time it takes to sell a home in Chicago has not changed much in the last year. I say “surprisingly” because with inventories so low you would expect the market times to be plunging but that’s not really the case. Single family homes that closed in February actually took longer to go under contract this year – 107 days compared to 104 days last year. However, condos did sell a bit faster this year – 95 days vs. 101 days last year. I guess the different dynamic at play between single family homes and condos/ townhomes is somewhat consistent with the fact that condo/ townhome inventory is lower than single family home inventory. But, still, they are both relatively low and falling.
#RealEstate #ChicagoRealEstate
Gary Lucido is the President of Lucid Realty, the Chicago area’s full service discount real estate brokerage. If you want to keep up to date on the Chicago real estate market, get an insider’s view of the seamy underbelly of the real estate industry, or you just think he’s the next Kurt Vonnegut you can Subscribe to Getting Real by Email using the form below. Please be sure to verify your email address when you receive the verification notice.


