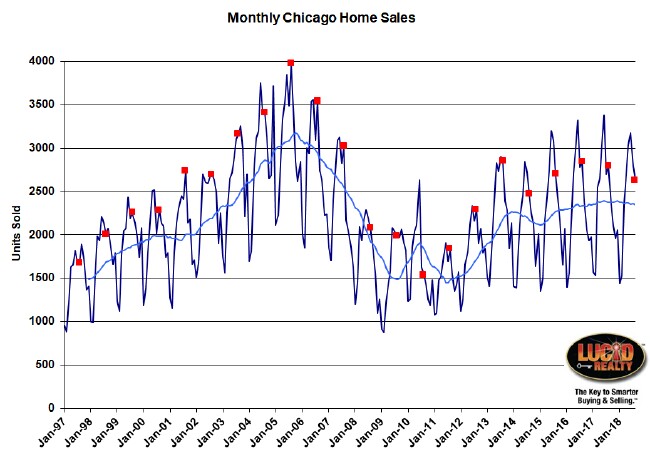
Looking at just home sales you could conclude that the Chicago real estate market is stuck in the mud. Take a look at the graph below, which shows monthly home sales going back to January 1997 with all the August points flagged in red. You’ll see that August’s home sales came in lower than the previous two years – 3.2% lower than last year. From the graph it may also appear that sales were lower than three years ago but that’s only because the final numbers are not yet in for August.
In addition, the light blue moving average line, which smooths out all the +/- months, continues to trend down. This has been the trend for several months. But home sales don’t tell the whole story of the health of this real estate market.
In about two weeks the Illinois Association of Realtors will report that August home sales in Chicago were down by 5.8% but that overstates the decline.
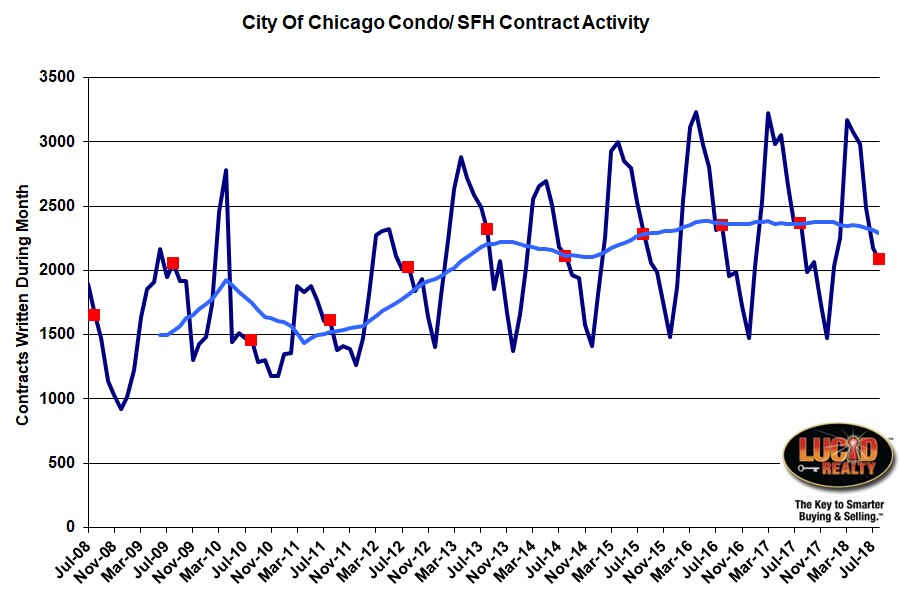
Chicago Home Contract Activity
For an idea of what future sales are going to look like we can check out the monthly contract activity, which usually leads closings by a month or two. I have it graphed below and, just like closings, contract activity has been trending down for some time now. I’m currently estimating that August contracts were down from last year by 11.8%, which would be the biggest drop in a little more than 4 years. So it’s no surprise that sales have been trending down.
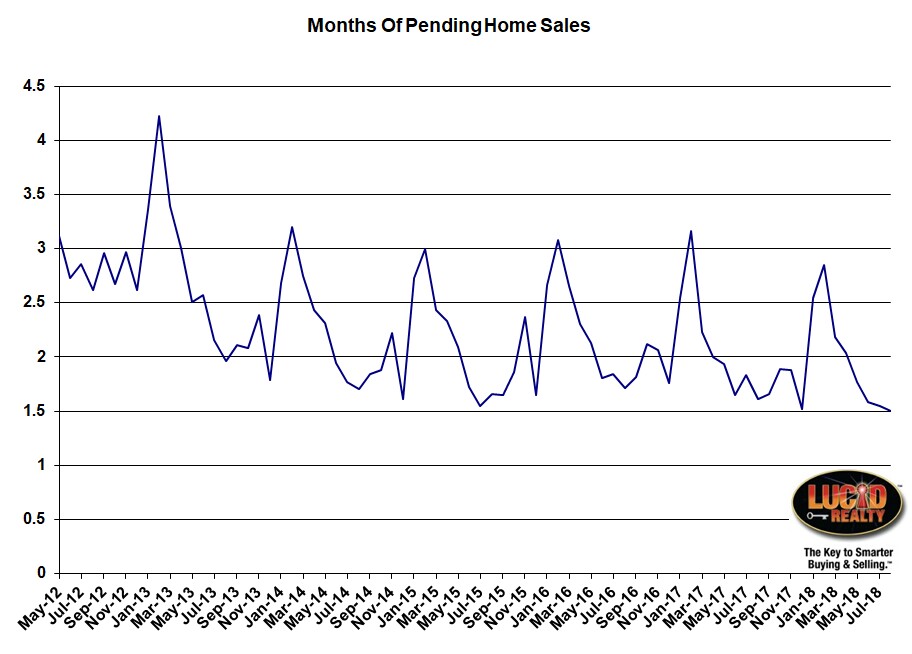
Pending Home Sales
Actually, given the low contract activity, you would expect sales to be lower than they are. However, we have been slowly drawing down the backlog of pending home sales – i.e. homes under contract, waiting to close – and that has been supplementing closings. We ended August with only a 1.50 month supply of homes under contract, compared to a 1.61 month supply last year. Eventually, we won’t be able to draw down this backlog any further – or it may even start to grow. At that point our sales may really look sad.
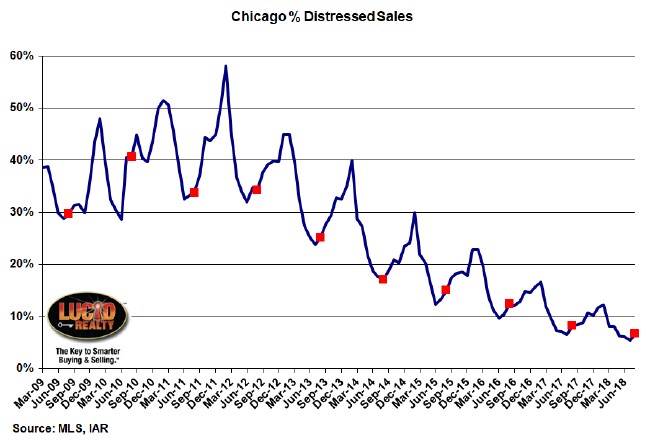
Distressed Home Sales
Once again the percentage of home sales that were distressed declined relative to last year – 6.8% vs. 8.2%. As you can see in the graph below, we had a huge problem with distressed home sales right after the housing bubble burst. But since then the percentage has been steadily declining for 8 years, though the magnitude of the declines have been shrinking as we reach zero.
Chicago Home Inventory
Home inventory remains unnaturally low, making it difficult for buyers to find homes, which is probably the biggest driver of our anemic sales. Detached and attached inventory levels are actually moving in opposite directions and have converged recently, with detached homes dropping to a 4.0 month supply from a 5.1 month supply last year and attached homes rising from 3.6 months of inventory to 3.9 months now.
Chicago Home Sale Market Times
The amount of time it takes to sell a home in Chicago appears to be moving in a direction consistent with the inventory levels. As attached inventory has risen that market time has increased slightly from 51 days to 57 days. Meanwhile, with less detached inventory competing for buyers that market time has dropped to 77 days from 80 days – not a huge drop though. But the bottom line is that homes are selling relatively quickly and that is a real indication of a healthy real estate market.
If you go to our Web site on any given day you can get the up to date real estate market data for Chicago.
#RealEstate #ChicagoRealEstate
Gary Lucido is the President of Lucid Realty, the Chicago area’s full service discount real estate brokerage. If you want to keep up to date on the Chicago real estate market, get an insider’s view of the seamy underbelly of the real estate industry, or you just think he’s the next Kurt Vonnegut you can Subscribe to Getting Real by Email using the form below. Please be sure to verify your email address when you receive the verification notice.


